CHAPTER 3
LESSON 14 How do antibiotic-resistant bacteria become more common over time?
What do we want to know?
ON YOUR OWN 
1.On a new page in your science notebook, write the date and “Lesson 14.”
2.Look at your Model Trackers for Lessons 12 and 13. What have we figured out?
WITH YOUR CLASS 
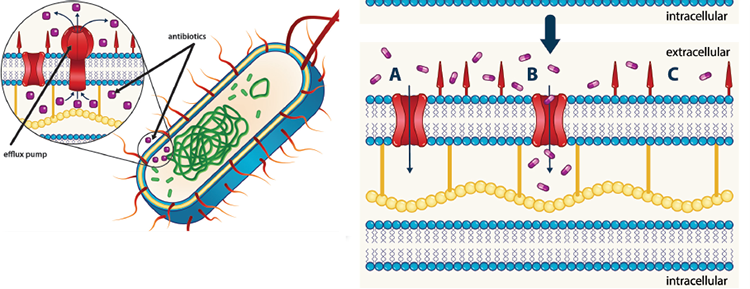
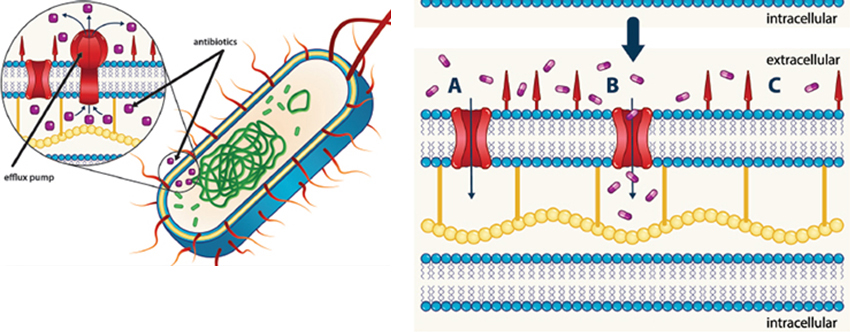
3.Discuss the structures that allow bacteria to resist antibiotics.
![]()

![]()
These images are to remind you of the pumps, the porins (our pores), and the cell membranes that bacteria have that can provide resistance to antibiotics.

TURN AND TALK 
4.Discuss these questions with your partner:
a.How can those structures help us explain what we see on the graph showing increasing antibiotic-resistant infections?
b.How can we investigate those ideas?
5.Decide as a class on the question we want to investigate next. Record this question on the page you started in your science notebook for Lesson 14.
Building complexity from a simple model
WITH YOUR CLASS
6.Discuss why we have to take multiple doses of antibiotics to treat an infection.
7.Review your Model Tracker from chapter 1 Lesson 3 and discuss how the simulation you used then might help you figure out today’s lesson question.
TURN AND TALK
8.Discuss this question with your partner:
a.What were the science ideas we represented by using different materials in the simulation with Lesson 3?
WITH YOUR CLASS
9.Discuss the science ideas you investigated in the Lesson 3 simulation and how you represented aspects of the model.
ON YOUR OWN
10.Consider how much you know now that you could help model a more complex system with antibiotic-resistant bacteria.
WITH YOUR CLASS
11.Use the quick count 1 or 5 hand signals to share out your thinking about aspects of a more complex model shown in the slides. Hold up your index finger if you only thought about that aspect of the model a little or not at all. Hold up five fingers if you did think about that aspect of the model and have ideas to share.
WITH YOUR GROUP 
12.With your group, write a list of science ideas that could be in a model of antibiotic-resistant bacteria growth.
13.Decide on which ideas are the top three most important and mark them with a star.
14.Ask who might be willing to volunteer to be the group reporter.
CHECK
Make sure your group …
✓Wrote down your ideas
✓Put a star by the ideas you think are most important
✓Has a reporter to share out your ideas
WITH YOUR CLASS
15.Participate in a share out called a whip around to create a list of science ideas for the class.
a.Each group gets a turn.
b.Report out 1 science idea, then the next group speaks.
c.If your idea is taken, put a check mark each time a group mentions it.
d.If your idea is taken, move to the next idea on your list.
e.If you have no more ideas, say “pass.”
TURN AND TALK
16.Discuss this question with your partner:
a.How can we build a complex model that is also accurate?
Designing a complex model
WITH YOUR CLASS
17.Follow classroom procedures on how to gather materials for the model activity. With your group, open Student Sheet 1.14.A: Simulation Instructions and Student Sheet 1.14.B: Data Table.
18.Review the assumptions on the top of the instructions.
19.Discuss the assumptions with your class.
WITH YOUR GROUP
20.Discuss the following questions with your group:
a.How probable is it that a single dose of antibiotics will kill 100 percent of the bacteria in an infected person?
b.Does each type of bacteria (resistant and susceptible) have the same probability of being killed by antibiotics?
WITH YOUR CLASS
21.Discuss how you will represent the different aspects of the model.
Aspect of model |
What it represents |
|---|---|
All the beads |
The population of bacteria in an infection |
Red beads |
Susceptible bacteria |
Pink beads |
Resistant bacteria |
Roll of the die |
Enough time passed and resulted in the next generation |
Number rolled |
Outcome (how many live or die) |
Desk |
The body |
This image is to remind you of how each aspect of the model is represented.
WITH YOUR GROUP
22.Decide on roles each member will play for the simulation. Remember to use the norms we have for collaboration.
23.Read through the procedures and complete the simulation.
![]()
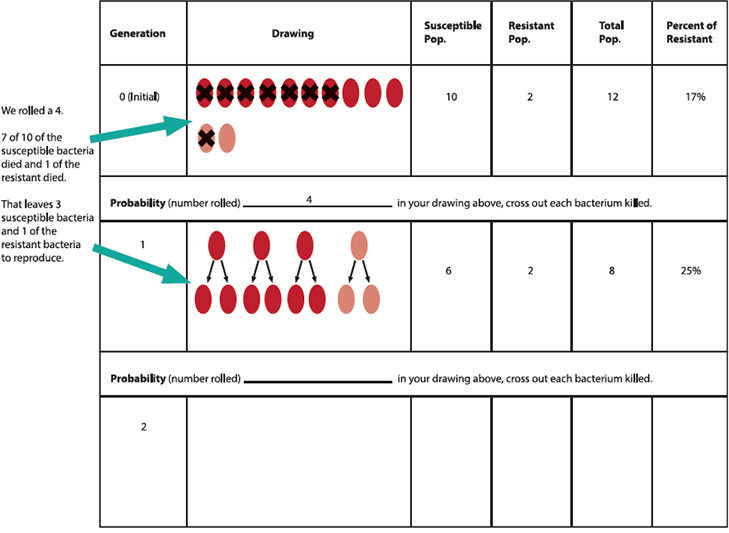
One way you could record the bacteria survival and reproduction on your data table.
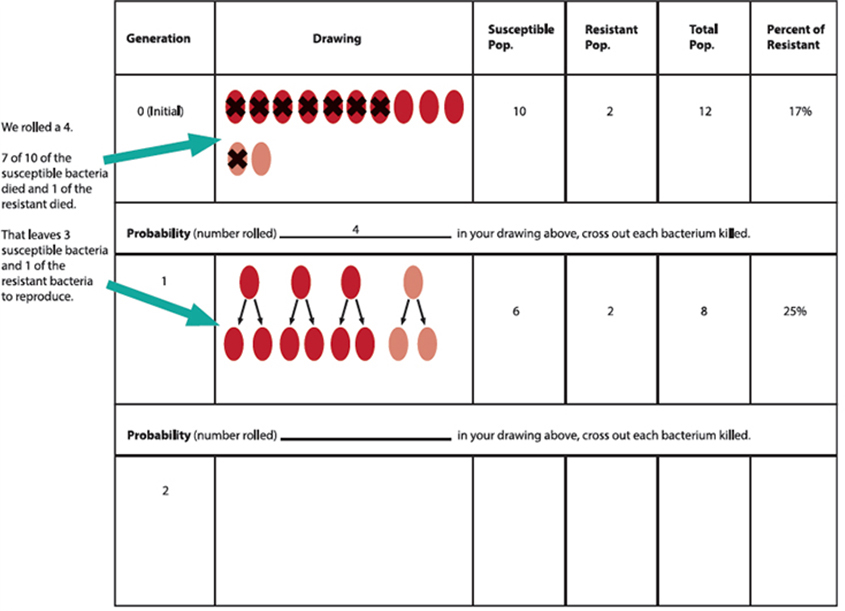
24.Complete the data table completely.
CHECK
Make sure your group …
✓Assigned roles to group members
✓Followed the procedures
✓Completed the data table completely
TURN AND TALK
25.Discuss which columns of data on the data table might have results that are helpful or interesting if you were to create a graph.
Publishing results
WITH YOUR CLASS
26.Discuss the columns in the data table and the results you observed.
WITH YOUR GROUP
27.Each person will have a copy of Student Sheet 1.14.C: How to Make Stacked Graphs and the graph templates.
28.Read Student Sheet 1.14.C: How to Make Stacked Graphs.
29.Create two partner pairs in your group. Pair 1 will make the Total Population stacked graph. Pair 2 will make the Percent Resistant stacked graph.
30.Share graphs within your group and explain why and how that graph was important in communicating the data from your simulation.
31.Work as a group to use the I2 (identify and interpret) Strategy to create 2 statements and a caption for each graph. Be prepared to share out with the class.
CHECK
Make sure your group …
✓Assigned pairs the different stacked graphs
✓Shared the how and why of each type of graph
✓Completed 2 identify/interpret statements per graph
✓Completed captions that summarize each graph
ON YOUR OWN
32.Consider these questions and answer them in your science notebook:
a.How well did your simulation reflect our understanding of how resistant bacteria are becoming more common?
b.Did you run into anything where a part of the model didn’t work?
c.Did your simulation give your group the data you expected?
Consider other variation in organisms
TURN AND TALK
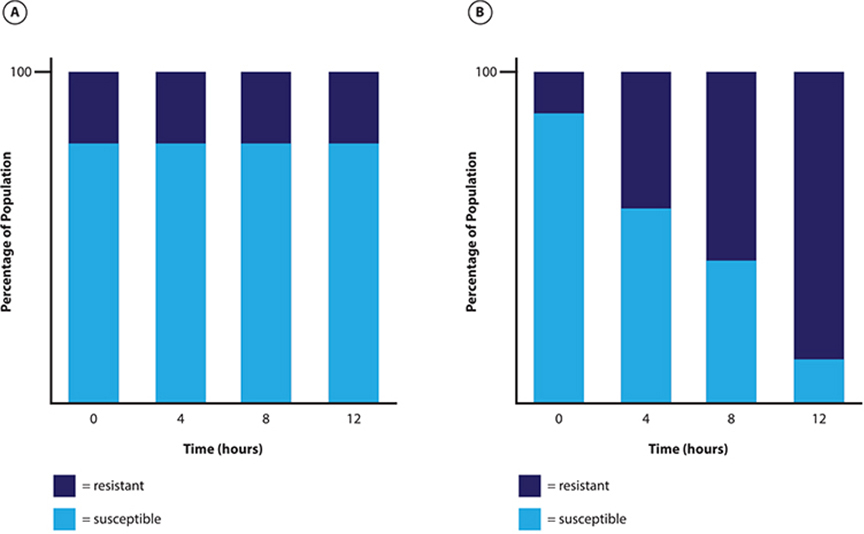
33.Discuss the graphs and answer this question:
a.Which graph best represents what would have happened if your initial population was exposed to antibiotics but the bacteria had all been the same (all are resistant).

![]()
Graphs that you need to compare.

34.Discuss the graphs and answer the question:
a.Which graph best represents what would have happened if your initial population had never been exposed to antibiotics?

![]()
Additional graphs that you need to compare.
WITH YOUR CLASS
35.Discuss the list of organisms that show a variety of traits.
36.Open Student Sheet 1.14.D: Selection Stories. Use your Science Reading Annotation Stems to set a scientific purpose for your reading. As you read, underline the traits that are present in the population. Put a star near the variation that is advantageous or helpful for survival.
37.Choose one story that you are most interested in.
WITH YOUR PARTNER 
38.Find a partner who has chosen the same story of interest.
39.With your partner, each of you can complete Student Sheet 1.14.E: Selection Story Analysis.
ON YOUR OWN
40.In your science notebook, record one similarity and one difference between the bacteria population and the population of the organism you and your partner had chosen.
Building our unique model
WITH YOUR CLASS
41.Return to your science ideas chart you did in the first part of the lesson and discuss ideas you want to add or expand upon.
WITH YOUR GROUP
42.Discuss how you can create a more complex model with additional assumptions than the one you did on the first day of the lesson.
43.Gather materials and Student Sheet 1.14.F Unique Simulation.
44.Decide on roles each member will play for the simulation. Remember to use the norms we have for collaboration.
45.Add your new assumptions and any new procedures to the instructions sheet and run the simulation.
CHECK
Make sure your group …
✓Assigned roles to group members
✓Followed your new procedures
✓Completed the data table completely
Publish new results
WITH YOUR GROUP
46.Work as a group to create stacked graphs and use the I2 Strategy to create 2 statements and a caption for each graph.
47.With chart paper and markers create a poster to communicate the assumptions and results of your unique simulation.
CHECK
Make sure your group …
✓Uses norms for collaboration
✓Includes a title
✓Presents new assumptions and procedures used
✓Shows both graphs with I2 statements and captions
Compare unique models
WITH YOUR CLASS
48.Discuss how to participate in a hosted gallery walk.
WITH YOUR GROUP
49.Choose someone to be a “host” at your poster to explain your model and answer questions from other groups.
50.Traveling group members should observe other posters as directed by the teacher, keeping in mind two questions:
a.What similarities or differences do you notice among the graph captions?
b.What was the process that caused the change in the bacterial population?
51.After all posters have been seen, explain the answers to the questions above to the person who was hosting for your poster.
52.Brainstorm other predictive models you may have encountered in your everyday life. Prepare to share out.
WITH YOUR CLASS
53.Discuss predictive models and their assumptions to answer these questions:
a.What questions should you ask about that model?
b.What might happen if a model uses faulty or limited assumptions?
WITH YOUR CLASS
54.Participate in a discussion about natural selection. Use the Word Wall and your science notebook to help you create a class definition of natural selection.
UPDATING OUR MODEL TRACKERS
WITH YOUR CLASS
55.Discuss with your class what we figured out through our investigations.
ON YOUR OWN
56.On the next page in your Model Tracker, record:
a.The lesson number and question
b.What we figured out
c.How we might represent that in a model
CHECK
Make sure you …
✓Show the changes in proportion of the bacteria.
SELF-ASSESS
Use the Model Tracker Self-Assessment and Feedback Tool to evaluate your model so far.
What should we do next?
WITH YOUR CLASS
57.Discuss how we can use all the information we have learned to explain why Zach’s infection was so difficult to treat and how antibiotic resistance is increasing.
58.Update the Word Wall with any new words we “earned” through our investigations in this class.
59.Review the Driving Question Board—what can we still not answer or explain? Add any new questions. Work together with your classmates to decide what we still need to know, and what we should investigate in the next lesson.