CHAPTER 10
LESSON 3 How might the removal of a top predator affect other populations?
What do we want to know?
ON YOUR OWN 
1.On a new page in your science notebook, write the date and “Lesson 3.”
2.Reflect on the previous lesson, and consider some of the ways coyotes and wolves differ and how those differences might explain changes in their populations.
TURN AND TALK 
3.Discuss your ideas with your partner:
•How might being a generalist or specialist species impact the way the species population grows or declines?
•How could those trends influence the interactions we identified?
WITH YOUR PARTNER 
4.Open Student Sheet 4.3.A: Comparing Canids. Read and obtain information from the text to identify important differences between coyotes and wolves. Discuss how these differences may have contributed to the population trends observed.
X
|
X
|
X
|
X
|
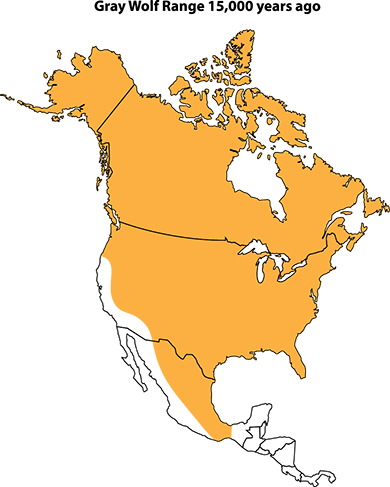
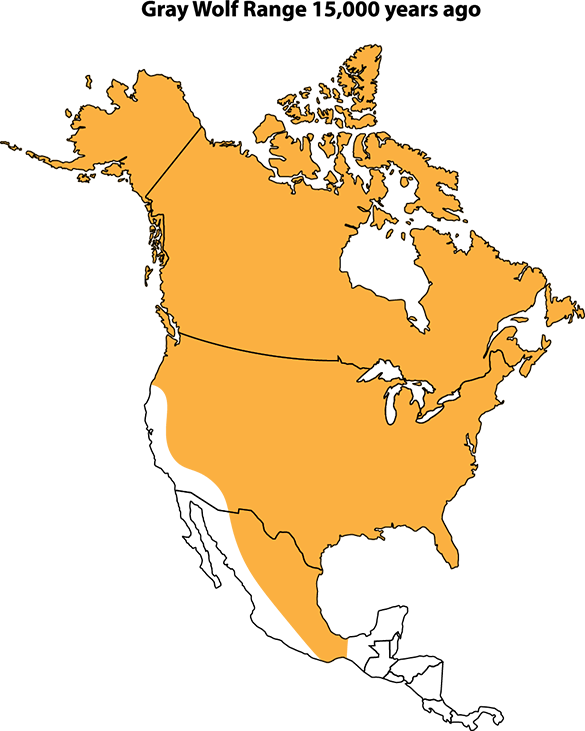
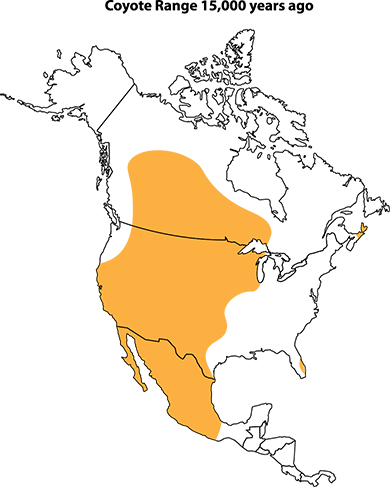
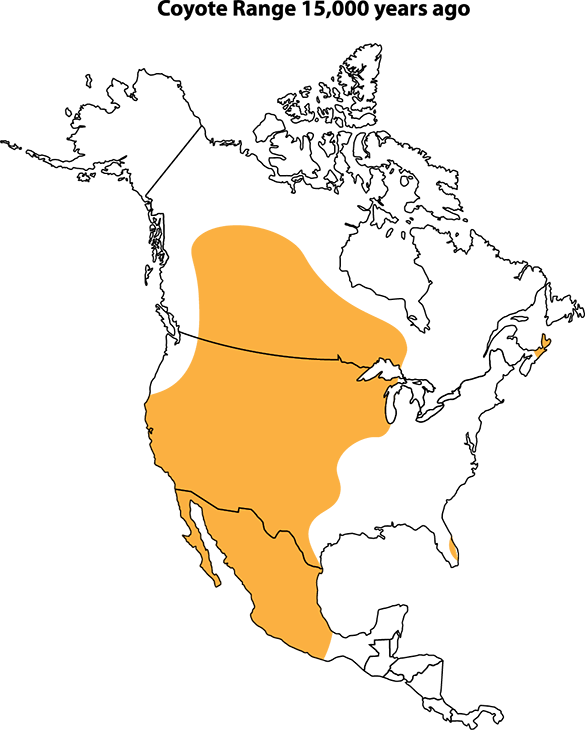

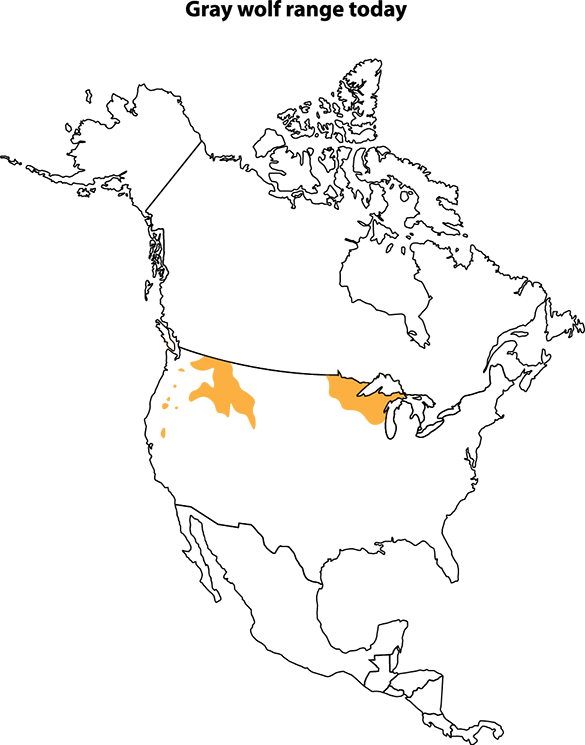
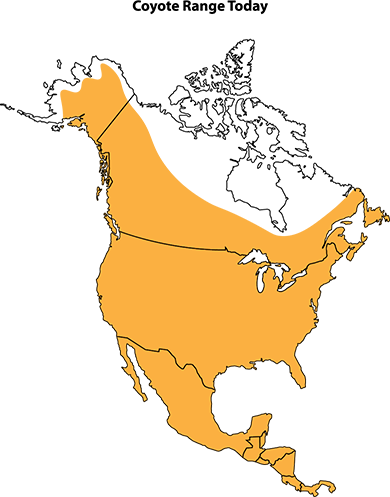
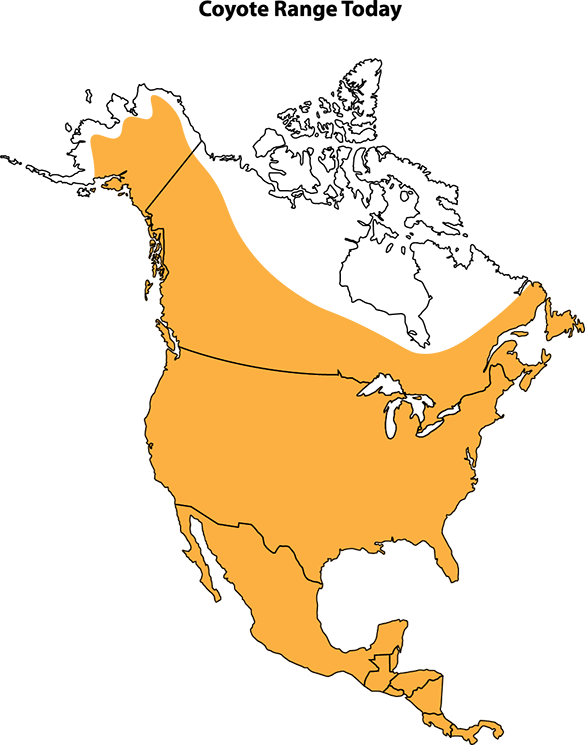
Change in range over time for gray wolves and coyotes.
5.Open Student Sheet 4.3.B: Why Wolves?. Consider your purpose for obtaining additional information from this text.
a.Read and annotate the text.
b.Work together to use information from Student Sheets 4.3.A and 4.3.B to explain why wolves saw a dramatic population decline while coyotes did not.
WITH YOUR CLASS 
6.Decide as a class on the question we want to investigate next. Record this question on the page you started in your science notebook for Lesson 3.
Investigate effects of removal of a predator
TURN AND TALK
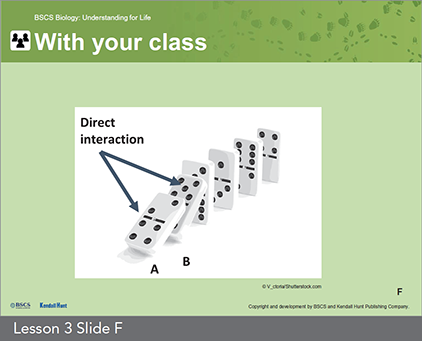
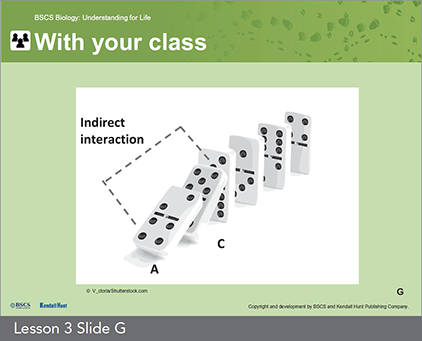
7.Turn and talk with your partner to discuss examples of a “domino effect.”
WITH YOUR CLASS
8.Consider the representations suggested for direct and indirect effects that occur in a domino effect situation.
![]()

![]()

How are direct and indirect effects modeled in the case of the domino effect?
WITH YOUR GROUP 
9.Organize into a small group of 3 students. Open Student Sheet 4.3.C: Interaction Cascades. You will “jigsaw” the reading in your group. Each group member should read one of the Interaction Cascade pages.
10.After reading your Interaction Cascade scenario, complete the chart on the page. Then, take turns sharing out the examples and key details with the group.
TURN AND TALK
11.Discuss your ideas with a partner: Do you think the impact of wolf removal would be the same as that for another species’ removal from that ecosystem?
12.Think about the Interaction Cascade scenarios you read. Discuss the prompts:
•Which factors limited or promoted growth in populations in your cascading interaction model?
•What other data would you like to see to make sense of these models?
Investigate factors affecting population size
ON YOUR OWN
13.Think about other times we have figured out how and why populations grow.
WITH YOUR CLASS
14.Contribute your ideas about what you remember about bacterial population growth from unit 1.
15.Participate in a discussion about the information we have about coyotes that might help us create a model to predict population growth. Return to your copy of Student Sheet 4.3.A: Comparing Canids during the discussion.
16.Help the class identify important variables and numbers to include in a mathematical expression or model for predicting population growth.
17.Participate in a discussion to help formulate a method of calculating coyote population growth over multiple years.
•Which variables will change after each generation?
•Which variables will stay the same year after year?
TURN AND TALK
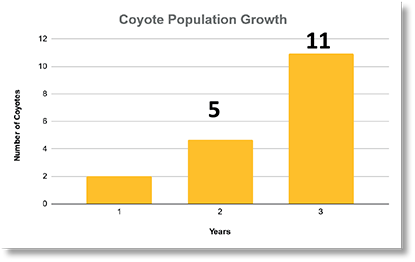
18.Consider the results of a model of coyote population growth over 3 years. What do you predict will happen over a longer period of time, such as 12 years?
![]()
A mathematical model predicts an increase in the size of the coyote population over time.

WITH YOUR CLASS
19.Examine the data your teacher provides for the size of the coyote population in years 3 to 12. Consider what year 13 will look like.
TURN AND TALK
20.Discuss with a partner your thoughts on the growth rate we’ve observed.
•Does this growth rate make sense for a coyote population?
•What might be another piece of information we should account for in our model to predict growth?
WITH YOUR CLASS
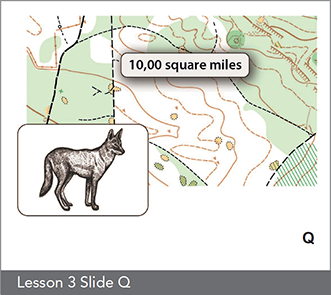
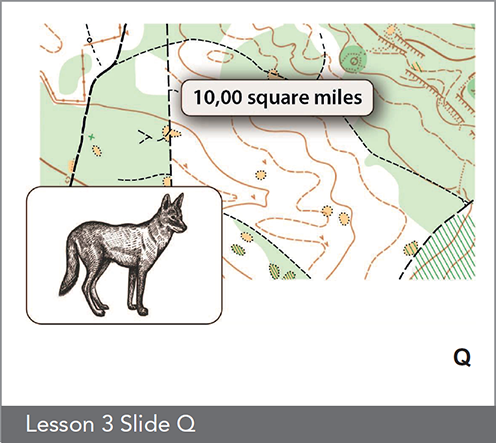
21.Revisit details we know about coyote packs and territory. Coyote packs have 3 individuals on average and each pack requires about 5 square miles.
![]()
Available land and the resources within the habitats of a space are limited. How might that affect population growth? Can we predict the number of coyotes supported by 10,000 square miles?
22.Participate in a discussion about carrying capacity and our model of population growth.
TURN AND TALK
23.Work with your partner to figure out the year (between 3 years and 12 years) in which the coyote population exceeded the carrying capacity of 10,000 square miles.
CHECK
Make sure you …
✓Check your answer with the graph your teacher provides.
WITH YOUR CLASS
24.Participate in a discussion about the effects of a population reaching or exceeding carrying capacity.
TURN AND TALK
25.Turn and talk with your partner about what limiting factors, other than space, might increase or decrease the carrying capacity of an area.
Obtain Information
ON YOUR OWN
26.Get a Carrying Capacity Scenario card from your teacher. After reading the scenario, look around the room for a graph that seems to show a pattern matching your scenario.
WITH YOUR GROUP
27.Move to the carrying capacity graph that represents your scenario.
a.Discuss with the group what evidence from the graph supports the information in the text.
b.Work together to develop an explanation of how the limiting factors in the scenario impact the carrying capacity seen in the graph.
c.Prepare to share your group’s explanation with the class.
UPDATING OUR MODEL TRACKERS
WITH YOUR CLASS
28.Participate in a discussion to help add words we’ve earned to the Word Wall. Add the words to your personal glossary if it is helpful.
ON YOUR OWN
29.Return to the Model Tracker for this unit in your science notebook.
a.Create a new entry for Lesson 3 and record the lesson question.
b.Discuss with the class what we have figured out during the lesson. Add the key ideas to your Model Tracker.
c.Decide how to represent the important ideas in a model.
SELF-ASSESS
Use the Model Tracker Self-Assessment and Feedback Tool to evaluate your model so far.
What should we do next?
WITH YOUR CLASS
30.Consider all we have figured out about wolves and coyotes in these lessons. Is there anything else we might need to investigate about coyotes, territories, and population growth or range expansion? Add new questions to the Driving Question Board or record them in your science notebook.