UNIT 1 • CHAPTER 2 • ASSESSMENT
Chapter assessment

TIME
One 50-minute class period
The purpose of a Chapter Assessment is to gain information about student progress toward the chapter learning goals and assess their readiness to begin the next chapter. This assessment requires students to use core ideas, science practices, and crosscutting concepts to make sense of phenomena. Some of the phenomena used are similar to the ones the students experience in the classroom, while others are new and require students to apply what they learned.
 CHAPTER LEARNING GOALS
Construct an explanation for howsystems of specialized cells can work together tocounter the negative effects of infection on body functions.
Obtain information to develop a model that explains how feedback mechanisms can respond to changing conditions to help the body attempt to maintain a healthy relatively stable state.
What we are not expecting
Where we are not going yet
We are not yet investigating how antibiotics work, how differences in traits can give some bacteria an advantage in a hostile environment, nor how natural selection can lead to antibiotic resistance.
Boundaries
We do not expect students to have memorized all the types of immune cells and signaling molecules they encountered within this chapter.
Relevant common student ideas
Only certain tissues, like blood or brain tissue, are made of cells. (All tissues are made of cells.)
Organisms do not have/are not made of molecules. (Atoms are arranged and bonded together to make specific molecules; molecules are arranged together to make cell organelles (and then cells → tissues → organs → organ systems → organism).
If your immune system is healthy, you don’t get sick. (People with healthy and responsive immune systems are at risk for bacterial infection and will sometimes need antibiotics to help the body recognize and defend itself from damage-causing bacteria.)
Homeostasis is adapting to the external environment. Homeostasis is not needed when the internal and external environments are equal. (The similarity of environments does not contradict homeostasis. Homeostatic mechanisms maintain stable concentrations of substances and stable values for different parameters in the body’s internal environment.)
Homeostasis is a state of conditions kept constant and preventing changes. (Homeostasis is a dynamic, bidirectional process achieved by continuous adjustment of minor deviations.)
LESSON MATERIALS
Per student
Colored pencils (optional)
Per class
Computer with projector
Preparation
Before administering this assessment, ensure that students had the opportunity to engage in the Synthesize Lesson for this chapter.
Ideally, also ensure that students have received feedback on their Model Tracker entries for chapter 2 (using the Model Tracker Formative Assessment Tool).
Review the assessment yourself and preview it for challenges.
Make a copy of Chapter 2 Assessment for each student (color copies are ideal, but the assessment will reproduce well in black and white).
 NAVIGATE
PURPOSE | To maintain coherence and continuity
Introduce the assessment.
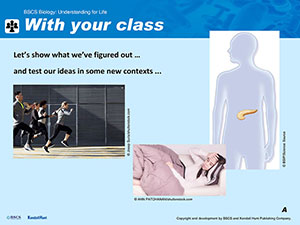
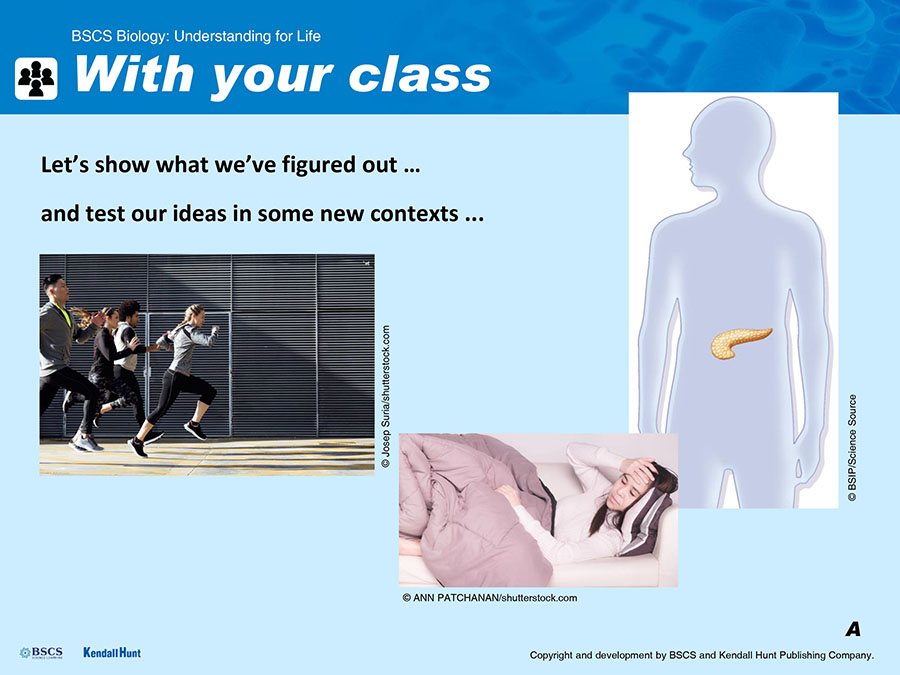
Let students know that we will spend this class period on an assessment. Display Slide A. Tell students that this is an opportunity for them to show what they have figured out. Explain that some of the questions on the assessment will be closely related to the things they are studying in class and other questions on the assessment will provide them with opportunities to apply their ideas to new contexts.
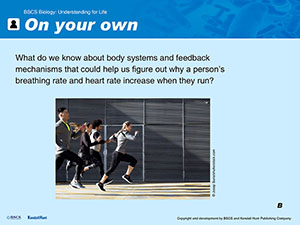
Display Slide B. Introduce students to the context of running. Give students a moment to individually consider the question posed on the slide.
 X
X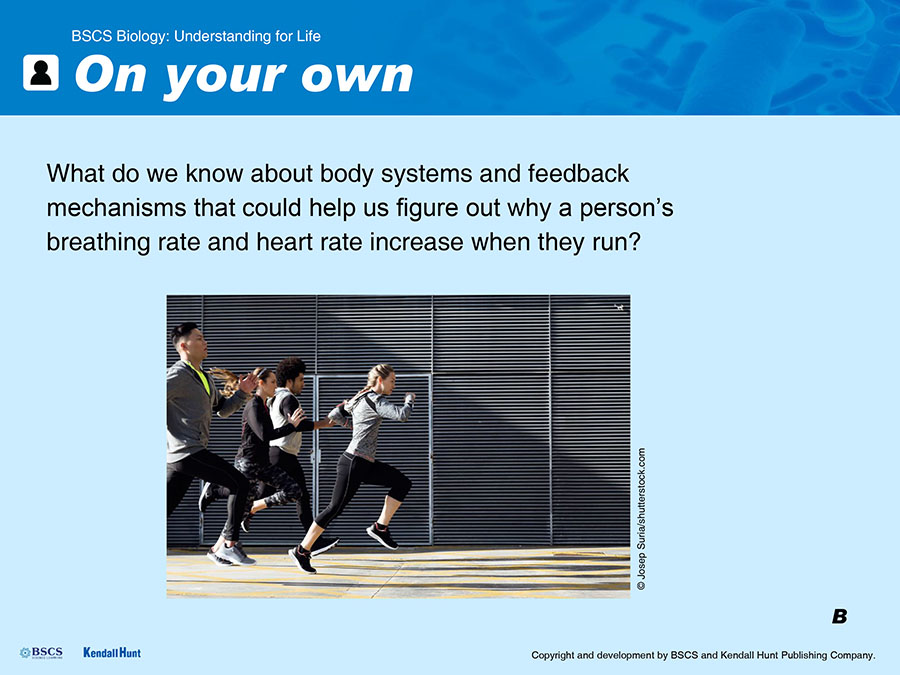
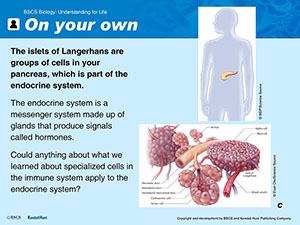
Display Slide C. Introduce students to the context of islets of Langerhans. Give students a moment to individually consider the question posed on the slide.
 X
X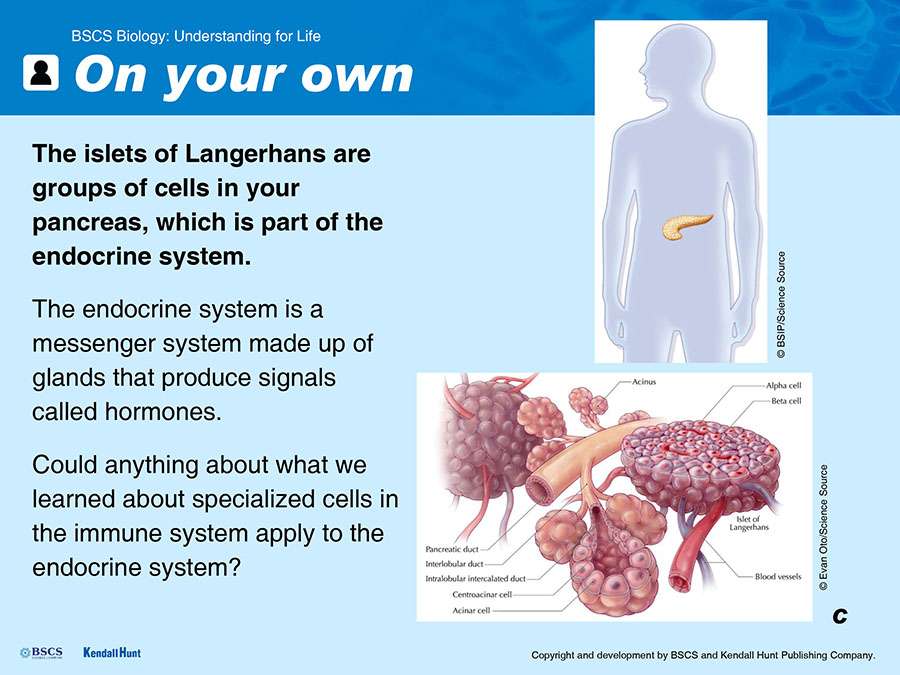
Remind students of the I2 Strategy, Close Read Protocol, and the Argument Tool.
Tell students that they may use the strategies, protocols, and tools they have learned during the chapter. The items will point out particular places where these strategies and protocols will be helpful.
CHAPTER ASSESSMENT
PURPOSE | To gain information about student progress toward the chapter learning goals
Distribute the assessment.
Students should receive the student version of the assessment as a student sheet. Students should be allowed to use extra blank paper if needed.
Allow students enough time to respond to the questions.
Students should be given a full class period to complete the test. Have a second activity ready to occupy students who finish early. If possible, students who need additional time should be given more time. The assessment is not intended to be a timed test.
Emerging Multilingual Learner Support
To better support emerging multilingual learners, consider reading (or having students read) the assessment item scenarios aloud, providing wait time for clarifying questions, before having students complete the assessment.
ITEMS AND SCORING GUIDANCE
ITEM 1

A student develops a fever.
1a.A student monitored her temperature every morning for 10 days. She woke up on day 4 with a fever accompanied by a stomachache and diarrhea. The doctor diagnosed her with gastroenteritis, which is sometimes called the stomach flu.
The fever lasted for 3 days. Describe what likely happened inside her body to cause the fever.
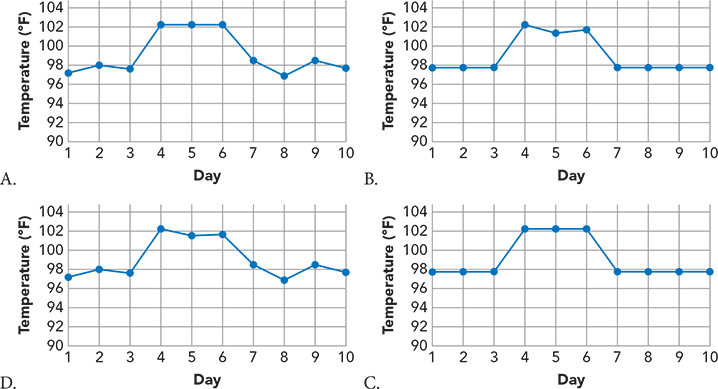
1b.Which graph best represents the likely temperature of the student over the 10-day period?
You may choose to use the I2 Strategy if it helps. Reminder: the I2 Strategy involves writing “what I see/what it means” statements.
1c.Describe why the graph you selected best represents the temperature of the student over the 10-day period.
1d.The student continues to monitor her temperature the following week. This time she records her temperature every 2 hours. One day, she sees that her temperature is consistently getting higher from 6:00 in the morning until 1:00 in the afternoon. She feels fine but is worried that she is getting a fever again.

The student’s body temperature from 6:00 a.m. to 1:00 p.m.
Is she correct in thinking that an increase in body temperature means a person is getting a fever?
Claim (answers the question with an explanation, a how/why account): (Select one)
A. Yes, an increase in body temperature always means that the person has a fever because they are fighting an infection.
B. No, an increase in body temperature is always caused by the person moving around more than usual.
C. No, a person’s body temperature fluctuates within a certain range, so it is normal to have periods of time where the temperature is increasing.
1e.Support (relevant evidence and describe how the evidence links to science ideas):
Self-check:
My claim answered the question.
My claim explained how and/or why something happens.
I included evidence from labs, readings, videos, or other sources.
I included science ideas that we agree on.
I included how each piece of evidence links to a science idea(s).
LEARNING PERFORMANCE
Describe that a fever is a response to an infection that is caused by the immune system that signals the body to create a higher temperature to support the function of getting rid of bacteria. Identify a graphical model of the temperature oscillation within a range of optimal body temperature and around fever range and describe why the selected graph is the best representation. Select a claim for why an increase in temperature over a short period of time is not necessarily indicative of a fever and support the claim with ideas about how body temperature oscillates within a range of optimal body temperature.
Example complete student response for 1a
Fever is our body’s response to an infection or inflammation. It is caused by our immune system. Specialized cells in the immune system detect bacteria and damaged body cells. They also send signals to communicate with other cells, and cause our body to raise its temperature. This response helps the body get rid of harmful bacteria by assisting the immune response and bringing the temperature outside some bacteria’s ideal range.
Correct response to 1b
Student selects answer choice C.
Example complete student response for 1c
I picked the graph in answer choice C because it shows that body temperature oscillates within a healthy range. When you have a fever the body sets the range higher than it normally is but there is still some variability.
Correct response to 1d
Student selects answer choice C.
Example complete student response for 1e
In class, we made a graph from temperature data taken over the course of a day and saw that body temperature fluctuates up and down within a range of temperatures. Our body uses a process called homeostasis to attempt to keep our temperature within that range. If you were to look at a small section of a graph of a healthy person’s temperature over time, you can see that there are times where the temperature is going up. In the data this student took, the increase in temperature is over a short period of time and it only increased about 0.8 degree, which is still within the normal range.
Item 1 Scoring Guide
Look for the following in student responses:
In part 1a, students should describe
that a fever is the body’s response to infection or inflammation and is caused by our immune system.
the role the specialized cells in the immune system play in detecting bacteria and damaged body cells and in signaling other cells causing an increase in temperature.
that increasing the body’s temperature helps the body get rid of bacteria.
In part 1b, students should recognize that the graph in answer choice C is the only one where the temperature oscillates within the normal range and the fever range.
In part 1c, they should justify their answer choice selection using the knowledge that body temperature oscillates around a healthy range, but body temperature goes above this range during a fever.
In part 1d, students should recognize that a small, steady increase in temperature is not necessarily an indication of a fever by selecting answer choice C.
In part 1e, they should
cite evidence to support their answer choice including the graphs they made in class of oscillations in daily temperature. Students do not have to remember all of the details from class (or exactly which documents or activities they came from). The important part is that they have evidence that small increases in temperature are normal because the temperature oscillates throughout the day.
mention that the body works to keep the body’s temperature stable within a range of temperatures.
reason that even though the student’s temperature was steadily increasing, it was over a very short period of time and the fluctuation was within the normal range; therefore, it is unlikely that this is an indication of a fever.
Note: Students do not need to actually check the self-check boxes; they are there as a reference for the students and should not be scored.
Look for the following in student responses that indicate the student is having difficulty:
Students may think that the day-to-day temperature of a person does not fluctuate, leading them to select answer choice D for 1b.
Students who think that the body temperature only changes when a person is sick will likely select answer choice B for 1b.
If students are having difficulty with the graphs, remind them to use the I2 Strategy to help them analyze the graphs and describe why they selected the one they did.
If students are having difficulty, draw their attention to the range for the y-axis and note that it is 1.5 degrees, which indicates that the temperature variation over this time period is small.
Students who think that the only normal increase in temperature is when a person moves around will likely select answer choice B for 1d.
The following sentence stem can be used for 1b and 1c with students who need writing support or are emerging multilingual learners: I think graph _______ represents the temperature of the student over the 10 days because _______.
The following sentence stem can be used for 1d with students who need writing support or are emerging multilingual learners: Evidence from investigations/an example from class was _______.
ITEM 2

A group of people running.
2a.A group of friends challenges each other to a race. They all run as fast as they can to the finish line.
At the end of the race, they notice that they are breathing faster than they were before the race started. They also notice that their heart is beating faster than before the race. The friends know that they need to take in oxygen by breathing. The oxygen they breathe in is transported throughout their bodies through the bloodstream. Their cells use the oxygen to carry out functions like movement.
Using what you know about body systems and feedback mechanisms, develop a model that explains why their heart rates and breathing rates increased when they ran the race. First, consider what components you will include. List the components below.
2b.What interactions between components will you include in the model? List the interactions below.
2c.Based on your list of components and interactions, draw a model that explains why the runners’ heart rates and breathing rates increased when they ran.
Self-check: In my model I …
Identified all the components my model needs.
Showed the interactions between the components in my model and included any initial conditions, inputs, outputs, and boundaries of the system(s).
Used my model to provide a description of how and why the phenomenon works.
LEARNING PERFORMANCE
Develop a model that describes how feedback mechanisms within the body can cause a person to breath faster and have a faster heart rate after running by first listing the important components and interactions that should be included and then drawing the model.
Example complete student response for 2a
I would include the following components.
Oxygen
Bloodstream
Heart rate
Breathing rate
The body running
Example complete student response for 2b
I would include the following interactions.
The process of running uses oxygen.
The decrease in the amount of oxygen in the bloodstream signals the body to increase the breathing and heart rate.
Increased breathing and heart rate causes the amount of oxygen in the bloodstream to increase.
The increase in the amount of oxygen in the bloodstream allows the person to run more.
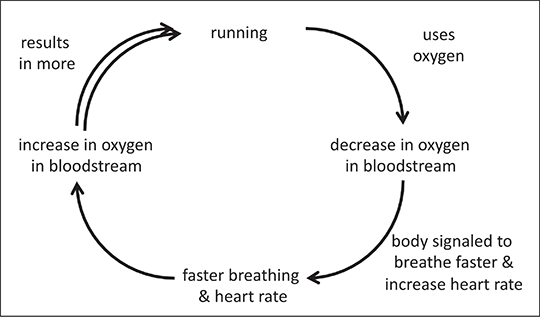
Example complete student response for 2c
Item 2 Scoring Guide
Look for the following in student responses:
In part 2a, students should list the relevant components of a model as described above in the example complete response.
In part 2d, students should list relevant interactions between components of the model that would help one understand why a person’s heart rate and breathing rate would increase when running.
Students’ models should resemble the feedback loops used in Lesson 9 and should include:
Running requires oxygen which will lower the amount of oxygen in the bloodstream.
A lower amount of oxygen in the bloodstream will signal the body to breathe faster and the heart to beat faster.
An increase in breathing rate and heart rate will increase the amount of oxygen in the bloodstream.
An increase in the amount of oxygen in the bloodstream will allow the person to run more.
Note: Students do not need to actually check the self-check boxes; they are there as a reference for the students and should not be scored.
Look for the following in student responses that indicate the student is having difficulty:
Students may have difficulty with this question if they are unfamiliar with how the body uses oxygen in cellular respiration to get energy to move. Some support was included in the stem, but more may be needed.
ITEM 3
3a.The pancreas is a part of the endocrine system and is located in the abdomen. It plays a role in regulating the amount of glucose (a type of sugar) in the blood. The part of the pancreas that regulates the blood glucose level is called the islets of Langerhans. They are large spherical clusters of cells as shown in the diagram below. Cells called beta cells in the islets of Langerhans release insulin, which is a molecule that signals the body to decrease the amount of glucose in the bloodstream.
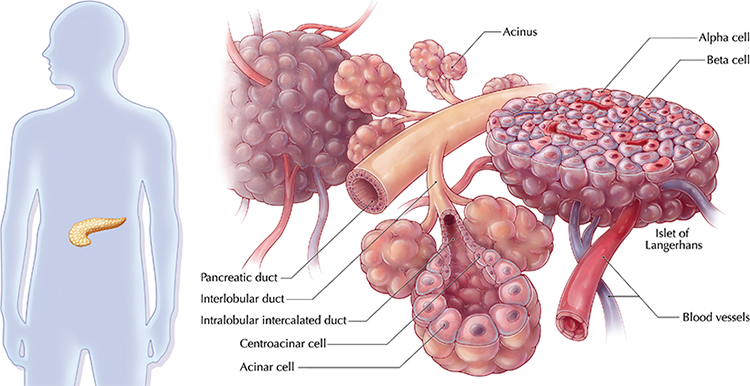
Illustrations of the pancreas (left) and inside the pancreas, the islets of langerhans and branches of the pancreatic duct (right).
After you eat a meal, the level of glucose in your blood increases. This increase in blood glucose causes the beta cells to release insulin into the bloodstream. The insulin then helps move the glucose out of the blood into other body cells. Once the blood glucose level decreases, the beta cells are signaled to stop releasing insulin.
Using what you know about feedback mechanisms in the body, develop a model that illustrates what happens to the amount of glucose and insulin in the bloodstream after eating a meal. Your model should be in the form of a graph with words and annotations to explain the change in amount of glucose and insulin in the bloodstream over time. Axes for the graph are provided below.

Self-check: In my model I …
Identified all the components my model needs.
Showed the interactions between the components in my model and included any initial conditions, inputs, outputs, and boundaries of the system(s).
Used my model to provide a description of how and why the phenomenon works.
3b.People with diabetes have fewer beta cells in their islets of Langerhans. Redraw the graphs in your model to represent the change in the amount of glucose and insulin in a person with diabetes. Axes for the graph are provided on the next page.

3c.Based on what you showed in your model, explain how having fewer beta cells affects the shape of the curves that represent the change in amount of glucose and insulin in the bloodstream after eating a meal.
Claim (answers the question with an explanation, a how/why account):
3d. Support (relevant evidence and how the evidence links to science ideas):
Self-check:
My claim answered the question.
My claim explained how and/or why something happens.
I included evidence from labs, readings, videos, or other sources.
I included science ideas that we agree on.
I included how each piece of evidence links to a science idea(s).
LEARNING PERFORMANCE
Develop a model to illustrate how feedback mechanisms within the body are used to stabilize blood glucose levels after a meal and modify the model to explain the effect of having fewer specialized beta cells in the pancreas on the shape of the curves representing the amount of glucose and insulin in the bloodstream over time.
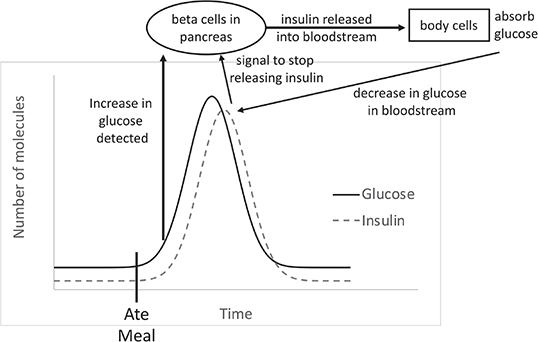
Example complete student response for 3a
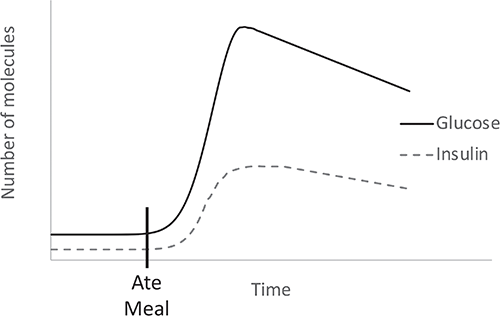
Example complete student response for 3b
Example complete student response for 3c
The curve for the amount of glucose in the blood would rise higher and then more slowly decrease and the curve for the amount of insulin would rise lower and then more slowly decrease because a person with fewer beta cells cannot produce as much insulin.
Example complete student response for 3d
The text above indicates that an increase in blood glucose signals the beta cells to release insulin. The increase in insulin will signal the body cells to take in glucose from the blood. The decrease in blood glucose then signals the beta cells to stop releasing insulin. This results in “bell-shaped” curves for the amount of glucose and insulin in the blood over time after eating. The text above also indicates that people with diabetes have fewer beta cells. This means that they cannot produce a lot of insulin. So when the blood glucose level rises and the beta cells are signaled, only a small amount of insulin is released. Therefore, it will take much longer for the glucose to leave the bloodstream. This results in a curve for glucose that increases higher after the meal and then decreases more slowly, because there is less insulin to tell body cells to absorb glucose from the blood. It also results in a curve for insulin that increases to a lower maximum height (because less is being produced) and then decreases more slowly (because there is more glucose in the bloodstream for longer).
Item 3 Scoring Guide
Look for the following in student responses:
For part 3a, students should use their understanding of feedback mechanisms to develop a model that includes graphs of the amount of glucose and insulin in the blood over time. Their models should be similar to the Class Consensus Model they made in Lesson 10 and should include these ideas:
High levels of blood glucose cause the beta cells in the pancreas to be signaled to release insulin.
Insulin in the bloodstream will signal body cells to absorb glucose from the blood.
Once the level of blood glucose returns to a normal level, the beta cells will be signaled to stop releasing insulin.
For parts 3b and 3c, students should reason that if the beta cells of a person with diabetes releases less insulin then the feedback mechanism will not work as efficiently and the glucose will slowly leave the bloodstream. Therefore, they should draw a line for glucose that increases sharply and then decreases slowly and a line for insulin that increases to a lower height and decreases slowly.
For part 3d, students should support their claim with evidence from the text including
An increase in blood glucose will signal beta cells to release insulin.
The increase in insulin will signal body cells to absorb glucose from the blood.
The decrease in glucose will signal the beta cells to stop releasing insulin.
People with diabetes have fewer beta cells.
For part 3d, students should reason based on the evidence and science ideas that
The evidence indicates that the amount of insulin and glucose in the bloodstream of a person without diabetes will follow a bell-shaped curve.
Fewer beta cells means less insulin can be released.
If less insulin is released, it will take longer for glucose to be absorbed by body cells.
This will result in a curve for glucose that increases sharply after a meal and then decreases more slowly.
This will also result in a curve for insulin that increases to a lower height and then decreases more slowly.
Note: Students do not need to actually check the self-check boxes; they are there as a reference for the students and should not be scored.
Look for the following in student responses that indicate the student is having difficulty:
The following sentence stem can be used for 3c with students who need writing support or are emerging multilingual learners: The curve for the amount of glucose in the blood would _______. The curve for the amount of insulin in the blood would _______.
The following sentence stem can be used for 3d with students who need writing support or are emerging multilingual learners: The text above indicates that _______. This means that _______.
NAVIGATE
PURPOSE | To maintain coherence and continuity
Congratulate students on their effort in completing the assessment.
Let students know that you will provide them with feedback on their responses.
Remind students that we still have ideas we haven’t completely explained and need to figure out how to explain the rest of Zach’s story.
Have students help you summarize the discussion the class had at the end of the Synthesize Lesson. Remind students about the questions they jotted down.
Share that in the next chapter, we will work toward answering some of those questions.