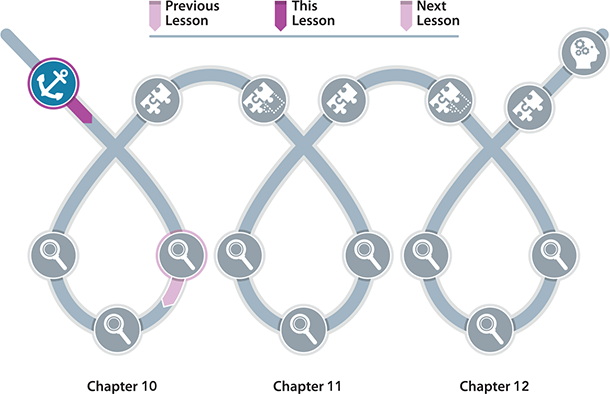
CHAPTER 10 • LESSON 1 • ANCHOR
Why are so many species declining now while a few seem to be expanding, and why does it matter?
PURPOSE | Introduce a puzzling phenomenon or problem and motivate further investigation.

TIME
Three 50-minute class periods
THIS LESSON | After examining a series of media headlines related to the loss of biodiversity, we explore the history of several species throughout time and notice patterns. We set our unit Driving Question, Why are so many species declining now while a few seem to be expanding, and why does it matter? This leaves us wondering why some species, coyotes in particular, are successful and others are not.
NEXT LESSON | We will figure out some reasons why some species are successful. In particular, coyotes fill a much more generalist niche than most species, and they interact with a wide variety of species, including gray wolves. This will leave us wondering how the removal of an apex predator, such as the gray wolf, impacts other populations within an ecosystem.
 LESSON LEARNING GOAL
Develop an initial model to ask questions about the change that occurs within populations over time, what causes the changes, and why it matters.
Lesson question
Why are so many species declining now while a few seem to be expanding, and why does it matter?
What students figure out
While the Anchor Lesson is mostly about exploring what we don’t yet know and what we want to investigate, students should come away with the following ideas:
Throughout history, many species have declined while others have been able to expand their range and increase their population numbers.
In the present day, many species are declining but a few seem to be expanding.
Throughout Earth’s history, there are fossil records of five mass extinction events and scientists suggest we are in the sixth mass extinction.
We are questioning why there are so many species declining while few seem to be expanding, and wondering why it matters.
What we are not expecting
Where we are not going yet
We are not yet trying to answer our unit question (Why are so many species declining now while a few seem to be expanding, and why does it matter?); rather, we are surfacing initial ideas and questions about the phenomenon.
We are also not yet trying to explain the causes of extinction, loss of biodiversity, and why species are declining, but rather students should simply notice there are some species that are declining or have gone extinct and others are expanding and there may be some patterns in characteristics associated with these organisms.
We are also not yet trying to explain human impact on the environment, but rather supporting students to observe the changes in human populations and ranges throughout time in comparison to other focal species in the environment.
We are also not yet trying to make connections between mass extinction events and present-day environmental conditions (e.g., increased carbon dioxide in the atmosphere), but rather supporting students to notice there are patterns in conditions that were present during the mass extinction events throughout Earth’s history.
We do not yet expect students to be able to justify those views using concepts of carrying capacity, evolution, and societal implications.
Boundaries
Though many students may have personal experiences and views on why the loss of biodiversity matters, we do not expect students to be able to justify those views.
Relevant common student ideas
The environment is a place where plants and animals live, not humans. (Humans are animals and are part of the environments we live in. Human-modified environments, from small to large, are still environments.)
The “balance of nature” is a real phenomenon that describes ecological systems. (The “balance of nature” is best understood as a metaphoric or poetic description. As there is no fixed idea of what it refers to, it is best not to use it in a scientific context.)
If a population in a food web is disturbed, there will be little or no effect on the populations that are not within the linear sequence in the food web. (Changes in abundance of one species often affect more than one other species through interactions like competition.)
Key literacy and sensemaking strategies
Science Notebooks
Students continue to use their science notebooks to record and keep track of their ideas.
Turn and Talk
Students continue to use turn and talk to share and practice articulating initial ideas before sharing them more publicly in a whole-class discussion.
Notice and Wonder Chart
Students use a Notice and Wonder format for capturing initial ideas about a phenomenon.
Scientists Circle
Students use the Scientists Circle to share ideas. Scientists Circle is a protocol for getting the whole class into a circle where they can see and hear everyone at once for certain key discussions. The purpose is to support students in expressing themselves and listening to peers during key discussions.
Initial Models and Consensus Models
Students make their first attempt in the unit at sketching an explanatory model; they also work together to decide what they do and don’t know so far by constructing an initial consensus model.
Driving Question Board
The class constructs the Driving Question Board for this unit. This publicly posed artifact will be a key touchpoint to track our progress and add new questions throughout the unit.
Ideas for Investigation Chart
Students build a list of ideas for data or information they could collect to help them make progress on their unit Driving Question.
ASSESSMENT
Pre-assessment: Then and Now story reflection
Students reflect on trends they notice with population data and relationships within an ecosystem. They also identify additional data they would like to have in order to strengthen their inferences. This reflection can reveal students’ background knowledge of ecosystems and relationships they may have learned about in middle school. Students may also have ideas about how humans interacted with organisms at different times in history.
Pre-assessment: Initial models
Students create initial models to show their understanding of why some species are declining while a few others seem to be expanding, and why it matters. Initial models are a great opportunity to get a sense of students’ understanding of the purpose and practice of sharing our ideas as models as well as what ideas they have from the then and now stories activity.
 ANCHOR LESSON SNAPSHOT
Lesson 1: Why are so many species declining now while a few seem to be expanding, and why does it matter?
BIG IDEA | Over a long period of time, species have gone extinct, new species have emerged, species have declined, and species have expanded; overall, more species are declining than expanding—notable exceptions are humans and coyotes.
Routine |
Part |
Time |
Summary |
Slide |
Materials |
|
1 |
10 min |
Examine media headlines related to the loss of biodiversity. Students examine a series of headlines that reveal the loss of species over time and consider if species loss is a natural trend or if something else may be happening to cause such drastic species loss. Students reflect on extinct or endangered species they are familiar with and what evidence exists for understanding those losses. Purpose: to surface students’ initial ideas about the loss of biodiversity, motivate students to consider what might be causing it to happen, and orient students to the central phenomena for the unit. |
A–D |
Science notebooks |
2 |
20 min |
Groups investigate different species through time. Groups analyze information about guilds of animals to observe changes in ecosystem interactions, populations, range, and natural history of species. Groups also create a scaled timeline to situate their species changes. Purpose: to support students to notice that throughout time changes in number and types of species present in certain areas have occurred, and throughout history some species have thrived while many others have not. |
E |
Teacher Resource: Species Then and Now Data Scissors Tape |
|
3 |
20 min |
Groups create Species Then and Now stories. Within their groups, students create a visual representation that shows the changes in each species’s populations and natural history over time. Students consider the need for additional data to understand changes. Purpose: to support students to summarize the changes they noticed and become familiar with using maps as a tool to describe species range and population data. |
F–G |
Chart paper Scissors Tape |
|
Suggested class period break End of Day 1 |
|||||
|
4 |
10 min |
Reflect on past units to identify opportunities for engaging core ideas, practices, and crosscutting concepts. Students consider what they have learned in the first three units of this curriculum and consider how this knowledge might help us investigate the phenomena of biodiversity loss. The class adds these ideas to the notice and wonder chart and considers how vocabulary is used in their Then and Now stories. Purpose: to make connections between students’ prior knowledge of populations, environment, and interactions from units 1 through 3 and use that knowledge as a starting point for investigating the loss of biodiversity. |
H |
Science notebooks Clearly Communicating Ideas Charts from units 1, 2, and 3 |
5 |
15 min |
Group revisions of their Then and Now stories. Groups consider how they represented concepts such as variation, environment, and populations in their survival storyline and make changes to reflect revised thinking. Purpose: to provide students a chance to revise and clarify representations of science concepts on their animal family story. |
Posters from previous day |
||
6 |
10 min |
Groups share findings with the class. Groups share their Species Then and Now stories with the class. A class discussion organizes observations of patterns and trends into a class chart. Students reflect on how this data connects to the headlines about biodiversity loss from day 1 and record questions. Purpose: to support students to see that the patterns for one species aren’t identical to the patterns of other species, but overall there are species being lost over time, and for some that are surviving, their range and populations have changed. |
Chart paper |
||
|
7 |
15 min |
Students create initial models. Students sketch models to show their thinking about the “how” and the “why” the changes in species populations and species range have occurred to try to explain: Why are so many species declining now while a few seem to be expanding? Purpose: to create individual models to share initial ideas/what we already know about loss of biodiversity. |
IJ |
Science notebooks |
Suggested class period break End of Day 2 |
|||||
|
8 |
10 min |
Create an initial Class Consensus Model. In pairs, students compare similarities and differences between initial models. Then, as a class, students look across all models and decide what the Class Consensus Model needs to include. Purpose: to come to a consensus about what to include in the class model about species loss and potential human impact. |
K |
Chart paper Sticky notes |
|
9 |
10 min |
Identify gaps: What can we still not explain? Looking at the Class Consensus Model, students identify gaps and questions their modeling exposed. The class compares these gaps and remaining questions that came up in their notice/wonder chart and realize they have even more questions and their questions are becoming more specific. Purpose: to motivate students to go deeper in their inquiry of the model species and species loss over time, to consider different perspectives, and to question if these species cases are unique or if this is a general trend that is occurring. |
L |
Science notebooks |
|
10 |
15 min |
Consider other extinction events throughout history. Partners read and annotate information about the past five mass extinctions and look for patterns in their causes and effects. As a class, students situate these events using a more appropriate scaling factor than the one they used before. Students consider how much time is involved in these massive changes as well as the time of smaller scale, incremental changes. Students compare these events with the headlines from day 1. Purpose: to support students to consider how rates of change can impact systems and compare past events with those occurring today. |
M–O |
Paper strip, masking tape, or yarn |
|
11 |
10 min |
Begin building our Driving Question Board (DQB) for this unit. Students review their notebooks, the class notice and wonder chart, and initial models and add questions on sticky notes (one question per note). As a class they add their questions to the DQB and consider which questions could be answered by science and which questions science might not be able to answer. Purpose: to brainstorm and list specific questions the class will work to answer together to gain a better understanding of the overall unit question and societal issue and to give the students agency in deciding which questions seem the most important to try to answer first. |
P–Q |
Chart paper Sticky notes Fine-tipped markers |
|
12 |
5 min |
Plan our next step. The class looks back at the questions on the DQB. Students notice many of their questions are about coyotes (the one species that seems to be expanding in range and population numbers) and their interactions with humans and determine the next steps that will focus on answering a fundamental question: what might have caused coyotes to be so successful? Purpose: to support students to prioritize the most basic questions on their DQB and motivate their investigation in the next lesson. |
R |
|
Suggested class period break End of Day 3 |
|||||


LESSON MATERIALS
Per student
Science notebook
Paper for initial models
Sticky notes
Fine-point markers
Colored pencils
Per class
Computer with projector
Markers
Cash register paper or masking tape or yarn to measure 4.6 meters
Clearly Communicating Ideas Chart from units 1, 2, and 3
Per group
Chart paper
Scissors
Tape or glue stick
Preparation
Clear a space in your classroom for students to display chart papers.
Make copies of Teacher Resource and Student Sheets.
Set up chart paper for Class Consensus Chart.
Masking tape, paper, or yarn measured and cut for the class timeline for 15,000 years ago to present for day 1 and then 4.6 billion years ago to present for day 2.
ADDITIONAL CONTENT BACKGROUND FOR THE TEACHER
A staggering statistic is that of all the species that have ever lived, 99% are extinct! Putting this in context, however, we know Earth has seen species come and go for millions of years. Right now, unfortunately, the rate of extinction in the past 100 years has been so elevated that many scientists, governments, religious entities, and financial leaders are gravely concerned.
Biodiversity is the abundance and variability of life on Earth at the genetic, species, population, and ecosystem levels. These systems that support all living things are in a dynamic state of stability and change. Changes can happen gradually or rapidly, which is often referred to as punctuated equilibrium.
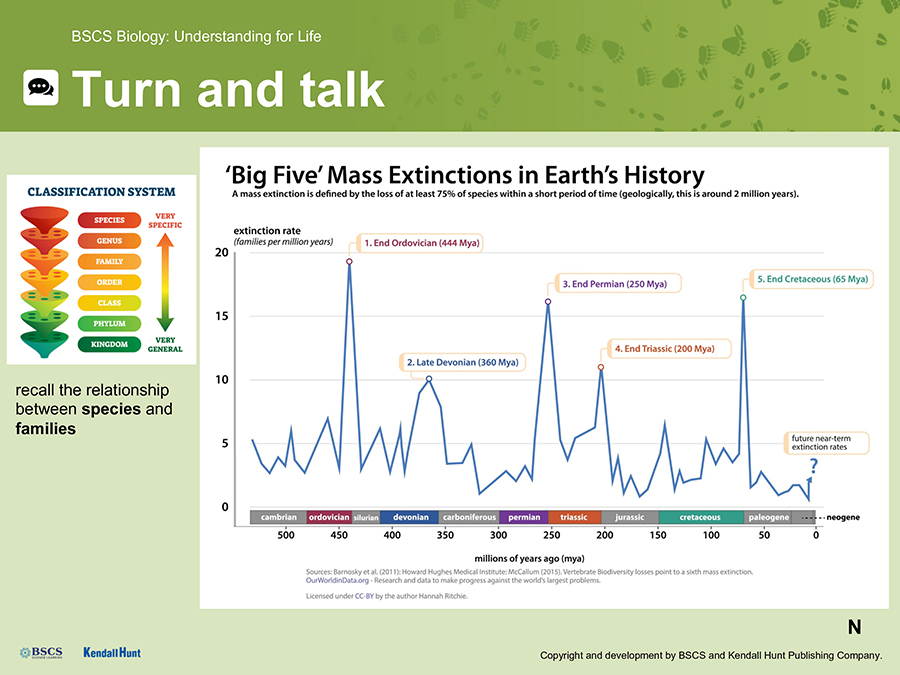
Earth has experienced five mass extinctions, the first occurring 443 million years ago when life was constrained in the oceans and 85% of all species living were wiped out. That left 15% to diverge and thrive in newly created conditions that led to the first land plants and animals. They thrived until a changing climate occurred, which then caused a second mass extinction. Giant shifts in climate, changing atmospheric and ocean chemistry, tectonic activities, and collisions with asteroids contributed to three more mass extinctions, the most famous being the one that occurred at the end of the Cretaceous. These events wiped out species on the scale of 80–90% in one fell swoop. In between these enormous catastrophes, there existed a low, steady drumbeat of extinctions. Species evolved, conditions changed, some survived, some did not.
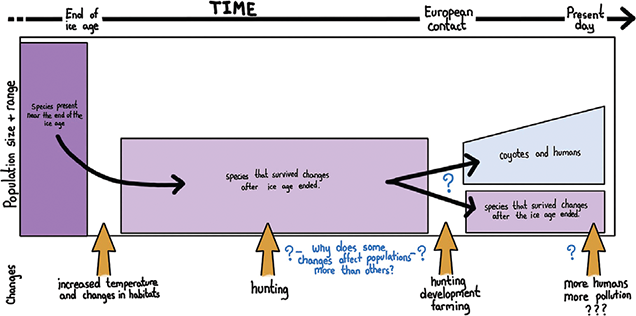
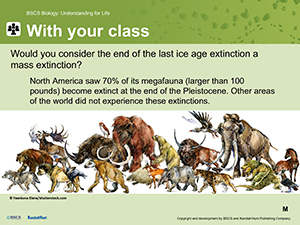
The end of the last ice age is a time of particularly interesting and engaging stories of stability and change. Charismatic megafauna like woolly mammoths and dire wolves offer a glimpse into successful species that were unable to adapt to environmental pressures such as climate change and efficient hunting by humans organized into groups. Other species, like coyotes, had life strategies and morphological changes that enabled them to thrive in the new world that emerged in North America about 11,700 years ago. And coyotes continue to thrive.
As students examine data, remind them to evaluate the claims they are making by considering if they have enough information to suggest causation or are really describing correlation.
Also, like all science, research is ongoing and as we learn more, our conclusions may be enriched or changed. For example, the date for when humans entered North America is being pushed back to earlier times as our technology and analysis methods improve. Likewise, the explanation of how humans traveled is being modified to include boats along a sea route supporting plentiful kelp forests with fish, shellfish, and marine mammals instead of just an overland route across the Bering Land Bridge.
These giant sweeps of time can be hard to conceptualize for students, so some activities include moments of reflection or inquiry that can help situate the extinctions and successes.
Population and range data for species are based on research that utilizes a variety of evidence such as fossils, genetics, population counts, and mathematical modeling.
 EXPLORE A PHENOMENON OR PROBLEM
PURPOSE | To engage with the central phenomenon or problem for the unit
Reorient students to the science notebook.
Let students know that just as in the previous units, we will be using our science notebooks as a place to collect our ideas and reflect on our thinking over time. Tell students to turn to the next new page, and have them write “Unit 4.” Direct students to leave at least 10 pages blank after the page that is labeled “Unit 4.” Then, on the next new page, have them write the date and “Lesson 1.”
Literacy and Multilingual Learner Support
The blank 10 pages are reserved for adding a Model Tracker, started in the next lesson, that students will come back and add to throughout unit 4. To facilitate this, you may choose to have students number the pages in their science notebooks; this will also help in cases of absence when students need to leave pages blank to go back and fill in.
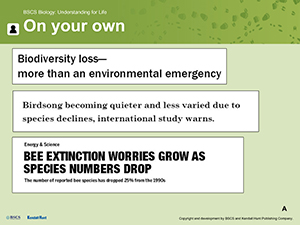
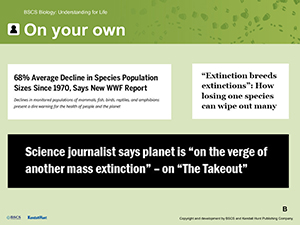
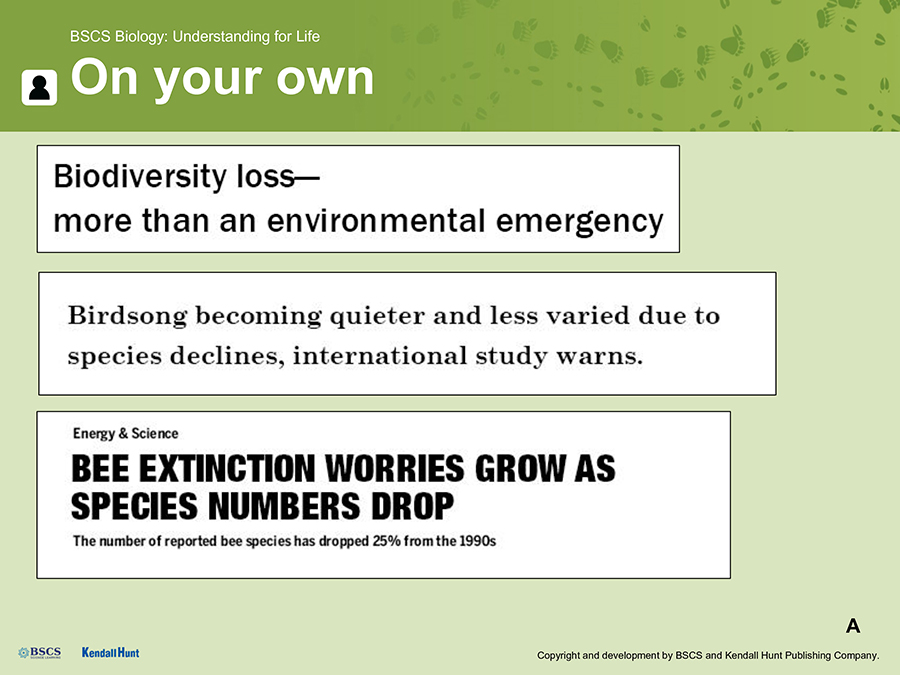
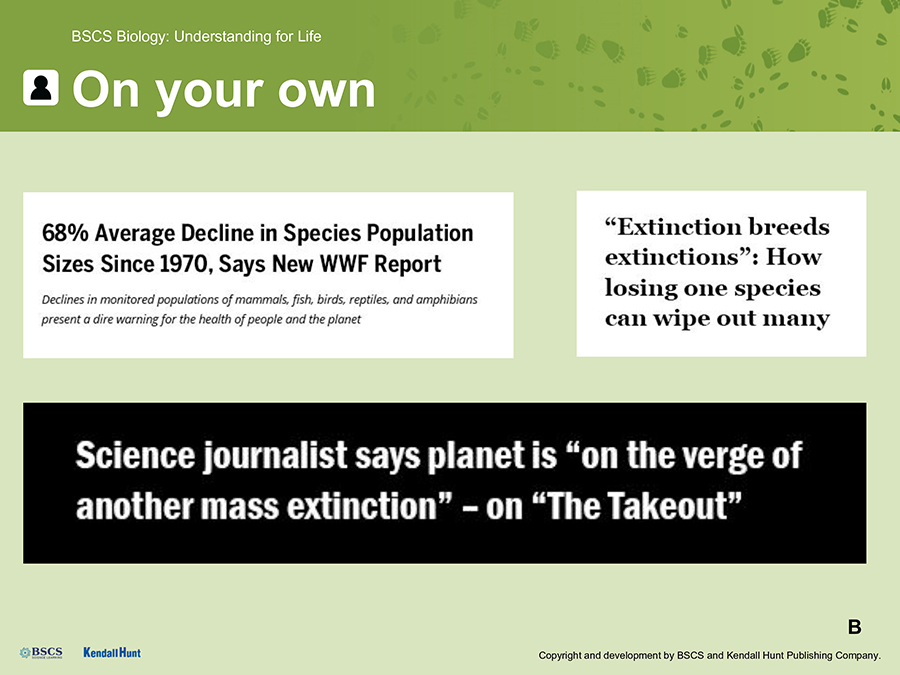
Introduce students to a collection of news headlines.
Display Slides A–B. Have students consider the headlines shown on the slides and consider if they think that species loss is a natural trend or if they think something else might be happening to warrant the sense of urgency in the headlines and to cause a drastic species loss.
 X
|
 X
|
Students turn and talk with a partner.
Display Slide C. Once students have considered the headlines on their own, ask students to turn to their partner and discuss the following prompts:
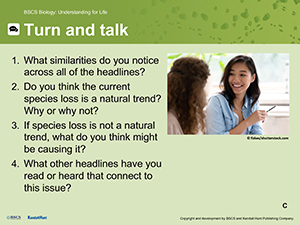
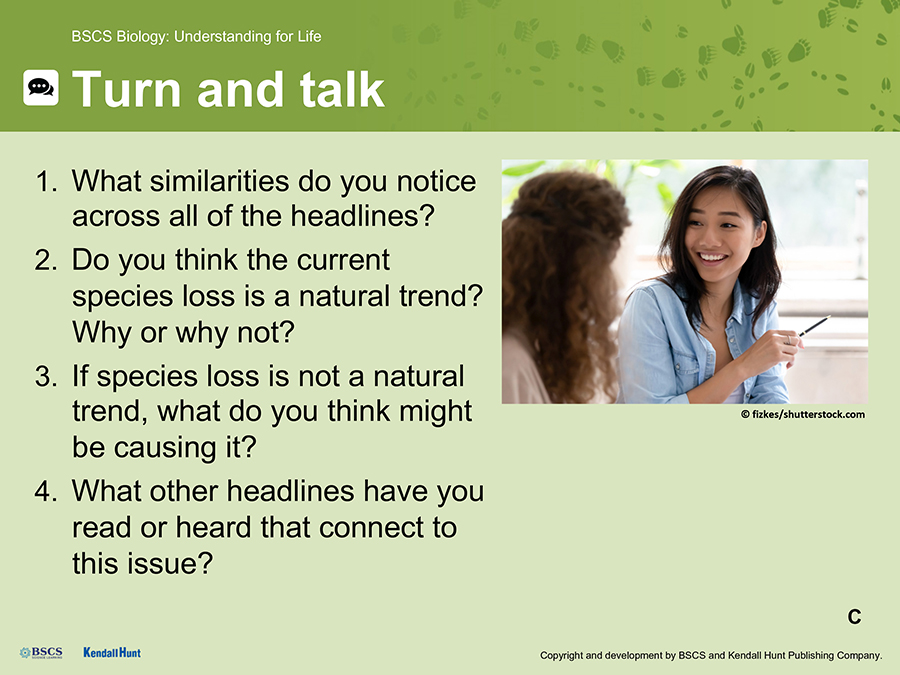
What similarities do you notice across all of the headlines?
What might be causing the decline or loss of species?
What other headlines have you read or heard that connect to the issue of species loss?
Let students know that we will capture our noticings and wonderings in a whole-class discussion. Providing students opportunities to share their ideas with a partner can help lower the stakes for students to contribute their and/or their partner’s ideas in the whole-class conversation.
Students discuss the headlines and our class noticings/wonderings.
Display Slide D. Put up a new piece of chart paper. Label the chart paper as shown below:
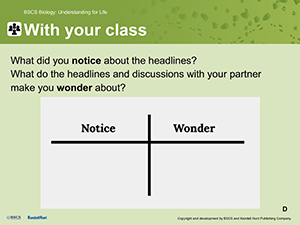

| Notice | Wonder |
Ask students to share out what they or their partner noticed and wondered about the headlines. Record all student ideas on the chart. You might revoice student ideas aloud as you write them on the chart paper. However, refrain from responding to any student ideas, even if they surface ideas that seem incomplete or incorrect.
Listen for student ideas and questions such as:
All the headlines seem to have a sense of urgency and give the impression that this problem of species loss is something we should care about.
I am not sure if current species loss is any different from those in the past; the articles make it seem like it is.
I wonder why all of these headlines sound so concerned about what is happening now.
I wonder if what is happening now to some of the species in the headlines is something that always happens or if it’s because of the things humans are doing.
One of the headlines said we were close to having a sixth mass extinction. I am not sure what that even means. Will humans be included?
Does it matter if a species goes extinct? Will it impact our lives in some way?
Students reflect and record any new questions.
Give students a moment to take stock of the class noticings and wonderings so far. Then, let students know that our notice and wonder chart can be a tool as we try to figure out more about the headlines and our ideas about species loss. Note that we have taken some time to think through the statements in the headlines more deeply, and that may have surfaced a few more things we are wondering about.
Give students a minute or two to individually reflect and jot down any additional questions in their science notebooks that have been raised about the headlines.
Developing the Practices: Asking Questions
After making careful observations of the headlines, students generate questions to help clarify and gather additional information that would help them further understand why the headlines are describing species loss and why it might be important.
Introduce students to Species Then and Now Data sets.
After students have had a chance to write down any ideas and questions they have in connection to the headlines, divide students into groups of 4. Suggest to students that because some of the headlines seem to suggest several species have been lost in recent years, it might be helpful to take a look at what has happened to different species to answer some of our questions about changes that have occurred over time and if these changes are expected. Invite students to consider what conditions existed initially and what changes may have occurred to disrupt the stability.
Explain to students that each group will be working with a packet of information that provides details about different organisms at different points in history. There is a packet for each of the following species (or groups of species):
Canids
Mammoths
Vultures/Condors
Diamondback Terrapin
Manatee
Horses
Bison
Humans
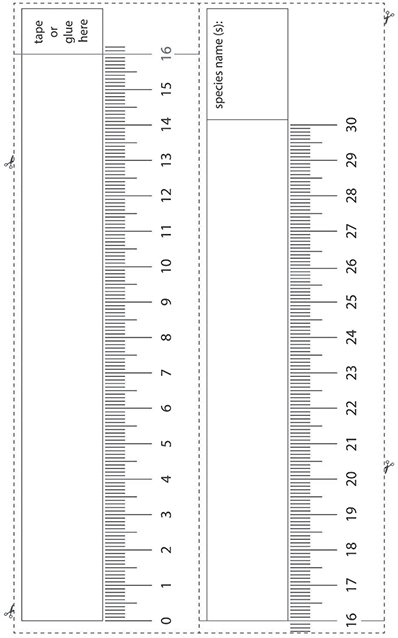
Each packet includes illustrated snapshots about the organisms’ ecosystem at two points in time: near the end of the last ice age, or the Late Pleistocene, and near present day. Each packet also includes a description of each focal organism including details about diet, habitat, behaviors, population changes over time, and range changes over time. Students are also provided with a scaled model they can cut out and tape to create a timeline for their species. This timeline can later be taped to their group poster as they develop their Then and Now stories.
Ask students to consider what strategies they may use to better understand the information and data included in their packets. Given that the packets include information presented in text, graphics, and data tables, students are likely to suggest using the close-reading protocol for reading text and the I2 strategy for interpreting data and graphics.
Literacy and Multilingual Learner Support
By this point in the curriculum, students have had opportunities to use both the Science Close Read Protocol and I2 strategy several times. Both of these can support students to make sense of text and graphics to start to understand the survival stories of the organisms included in their packets.
Groups investigate what happened to different species through time.
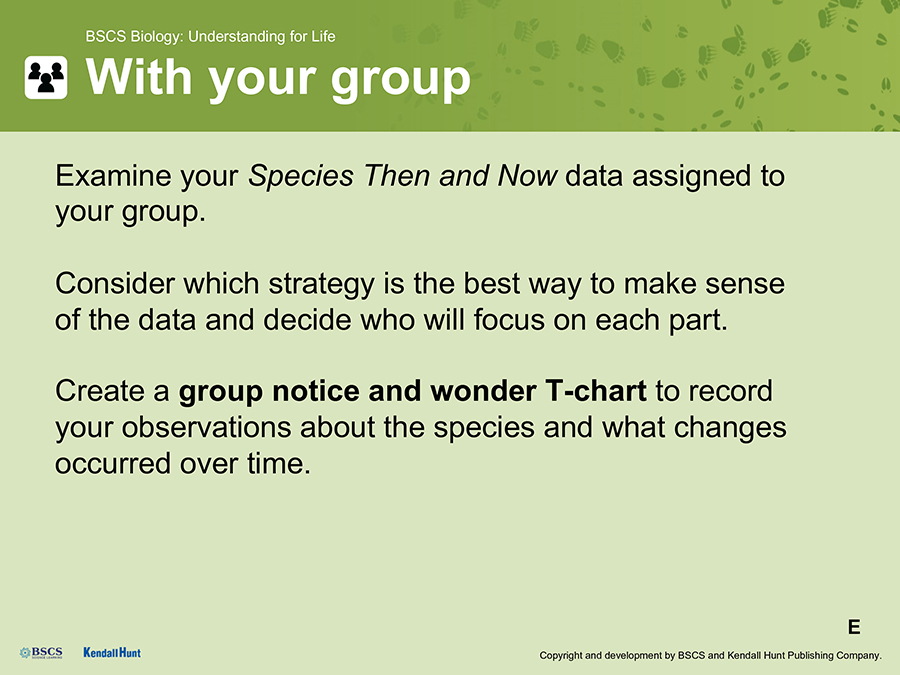
Display Slide E. Encourage groups to organize and record their observations about components of the species’s characteristics and changes in the population or species’s life history in a notice and wonder T-chart. As students are working together to analyze the information included in their packet, circulate around the room and listen for students ideas about what they are noticing. The following prompts may help to probe student thinking:
| Suggested prompts | Listen for student responses such as |
|---|---|
| What are you noticing about the organisms included in your packet through time? |
|
| What are differences in the depictions of the ecosystems at the two time points? |
|
| What happened to the population of each organism throughout time? |
|
| What happened to the range of each organism throughout time? |
|
| Are population and range data giving us the same information or are there differences between these two ways of looking at populations? |
|
| Are there characteristics of the organisms that you find particularly interesting? Did those characteristics change over time or did they stay the same? |
|
| Why might it be important for us to pay attention to the span of time included in our packets? |
|
| What were the time periods noted on the population data sheets and why are they significant? |
|
| Are the number of years between changes in population or range equal? | No, after the end of the ice age there is a lot of time when things seem stable, then within a few hundred years of today there are bigger changes. |
Consider creating an extra scaled timeline to post for the whole class throughout the Anchor Lesson. This will be lengthened to show more of Earth’s history later in the lesson.
Attending to Student Ideas
Students might not initially understand how population and range differ. While population relates directly to the number of individuals, range is about the distribution of those organisms throughout a geographic location that contains the set of conditions the organism needs. Both population and range can be impacted by similar factors.
Attending to Student Ideas
Working with a scale model of time can be challenging for students and is not the point of this activity in the Species Then and Now Data. Focus on the relationship on changes in populations that occurred and the amount of space represented between these key population events rather than the calculation that allowed for the representation.
Extension Opportunity
Students might find a fun challenge in creating different ways to represent or scale the time period. While the horizontal strip of paper is most familiar, students could use three different beakers and colored water with 10 mL equal to 100 years. Students might also think of other ways we can see the passage of time like tree rings or rock stratigraphy.
Students create a poster/timeline of their Species Then and Now stories.
Display Slide F. After students have had a chance to discuss what they notice and wonder in relation to the data for their group, ask students what information they would need to share with others to tell the story of the organisms included in their information packets throughout history.
Have students work together to create a visual representation that shows the changes in each organism’s population over time, as well as changes in range and any other important changes (e.g., diet, body characteristics, behaviors) that may help to explain the organism’s survival story. Stress the importance of including information for each organism detailed in the group’s packet, including the scaled timeline.
Students may choose to use some of the representations included in their group’s information packet directly by cutting them out and taping or gluing them on their posters, or students may choose to create their own representations to show trends in the range data and population data.
Let students know that they will have some additional time on day 2 of this lesson to continue to work on their representations.
Developing the Practices: Obtaining, Evaluating, and Communicating Information
By creating their own visual representation of the organisms’ survival stories, students will summarize the trends they noticed in both the range data and population numbers data. In doing so, students also will have the opportunity to integrate different sources of information presented in different formations to tell the survival story of each organism detailed in the information packets, and consider how these stories might connect to the headlines they considered at the start of the lesson.
Students reflect on the Species Then and Now data.
Display Slide G. Invite students to reflect on the data in their science notebooks.

| Suggested prompts | Listen for student responses such as |
|---|---|
| What information did you find surprising or interesting? |
|
| What data do you wish you had about your species to make sense of what happened over the past 15,000 years? |
|
Formative Assessment Opportunity
This reflection can reveal students’ background knowledge of ecosystems and relationships they may have learned about in middle school. Students may also have ideas about how humans interacted with organisms at different times in history.
SUGGESTED CLASS PERIOD BREAK
End of Day 1
EXPLORE A PHENOMENON OR PROBLEM
PURPOSE | To engage with the central phenomenon or problem for the unit
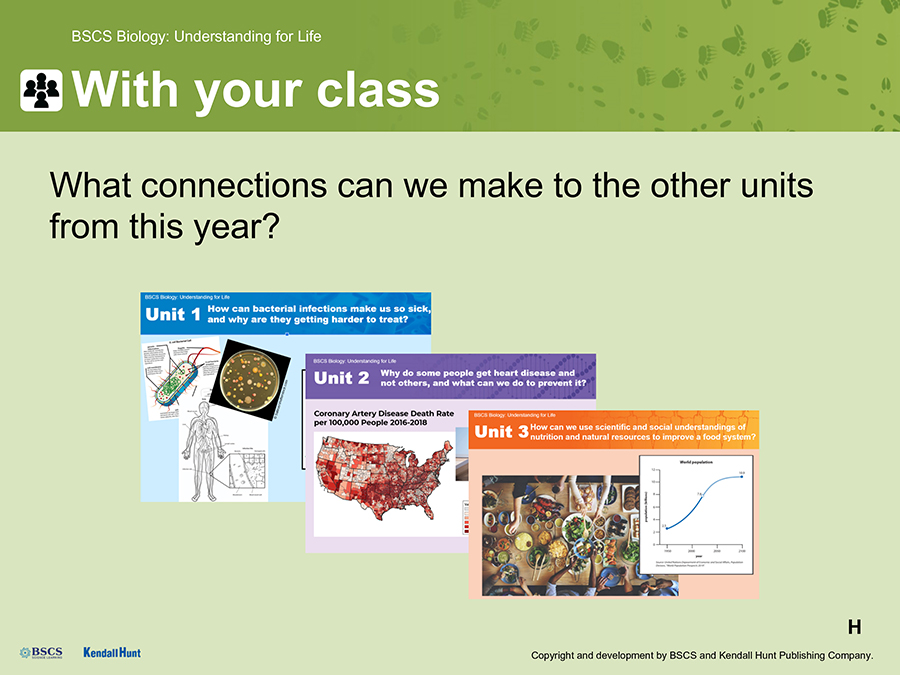
Students reflect on past units to make connections.
Display Slide H. Before students rejoin their groups to continue to focus on their representations, ask students to consider what connections they can make between the first three units of the course and some of the information included in their information packets. It may be helpful for students to look back at their Model Trackers for the first three units to remind themselves of some of the big ideas and crosscutting concepts that came up in those units.

| Suggested prompts | Listen for student responses such as |
|---|---|
| What connections can we make between what we have learned about in unit 1 and the information included in your information packets? |
|
| What connections can we make between what we have learned about in unit 2 and the information included in your information packets? |
|
| What about connections to unit 3? |
|
Students add these ideas to the class noticings/wonderings chart.
After the class has discussed the possible connections between what they are seeing in the headlines and their information packets with the previous units in the course, invite students to add these ideas to the class notice and wonder chart.
Students consider the language they used in connection to other units.
Tell students to join their species stories groups and consider the language/terminology they may have used to describe what was happening to each species in their information packet and whether that language has any connections to the ideas they learned in units 1, 2, and 3 (e.g., population, environment, variation). Ask students to consider if they are using the language/terminology in a way that is how they intend it to be understood. They may want to compare their current use with how the class used it in past units by checking their use against the Clearly Communicating Ideas charts for units 1, 2, and 3. Having an exact match between how we used the term before and how we are using it now is not the goal, but rather that we are reflective and intentional in how we communicate our ideas. For example, when discussing population or environment, we approach them as systems so we would always be sure to define boundaries and initial conditions.
Students make revisions to their Species Then and Now stories.
Have student groups consider how they represented concepts such as a population of organisms, variation within a population of organisms, and environment in which populations of organisms exist in their species stories and the connections they made to previous units. Support students to revise their thinking if needed, and clarify their representations of science concepts on their Species Then and Now stories.
Tell student groups that they are the experts for their species and will need to share their species stories with the class in the next step of the lesson.
Students share their findings with the class, and create a class data chart.
Once each group has had a chance to finalize their species story representations, bring the class back together to share representations with each other. Before groups start sharing their summaries of their representations, ask students to look quickly across the different representations groups have created, and ask students what might be helpful to keep track of as each group shares their stories.
| Suggested prompt | Listen for student responses such as |
|---|---|
| As we look quickly across groups’ representations, what might be helpful for us to keep track of as we hear each group’s Then and Now stories? |
|
Once the class has decided which details they want to keep track of, create a class data chart to keep track of these important pieces of information for each species. Allow each group to determine a speaker who will provide a short summary about each of the things listed on the class data chat.
Have each group present their summaries and record the important trends/changes in the class Then and Now Changes Chart. If the class decided to include initial ideas about why a trend may have occurred, stress to the class that these ideas are a great starting point to investigate further and may be something we also want to include on our notice and wonder chart.
| dire wolf | gray wolf | coyote | condor | Teratornis merriami | horses | mammoths | bison | humans | manatee | diamondback terrapin | |
|---|---|---|---|---|---|---|---|---|---|---|---|
| Population change |
|
|
|
|
|
|
|
|
|
|
|
| Range change | Y– | Y– | Y+ | Y– | Y– | Y– | Y– | Y– | Y+ | Y– | Y– |
| Change in body or behavior | – | Prey switch | Prey switch size behavior | Prey switch | – | – | – | Size | Possible size | – | – |
| Extinction | Y | Ylocally | nearly | Y | Ylocally | Y | |||||
| Reestablished | Y | Y? | Y |


Example Then and Now Changes Chart.
Students consider similarities and differences in the trends across species.
Once the class data chart has been compiled, ask students to look across the data to notice any similarities and differences in the trends they are seeing.
| Suggested prompts | Listen for student responses such as |
|---|---|
| What similarities are you noticing across species? |
|
| What differences are you noticing across species? | Coyotes and humans seem to be different from many of the other species in that their population trends are increasing and so is their range. |
Students may focus only on those species that have gone extinct or declined in population. You may want to draw attention to the coyote population as an anomaly compared to the overall trend and even highlight or draw a circle around the population arrows that show an increase on the chart for the class.
Students consider and record questions they have.
Invite students to take a few minutes to gather their individual thoughts about changes in their species then and now stories and the trends that emerged in the chart. Encourage them to record what they are still curious about as questions in their science notebook. These questions will be important to return to when building the Driving Question Board.
Students consider initial ideas of why certain trends may have occurred.
After students have noticed similarities and differences in trends across the species, probe students’ thinking about how or why some of these overall trends may be occurring. Press students to be clear with their language and discuss the differences between a correlation and causation.
Developing the Crosscutting Concepts: Stability and Change
Through this whole-class discussion, students will be able to share their initial ideas to explain how and why there are changes in species population numbers and their ranges over time.
Common Student Ideas
Students will likely have ideas about what caused certain species to become extinct and what has allowed other species to be successful over time. At this point in the unit, you can allow all of these initial ideas to surface. However, if students are using information from the class data chart to make claims about why a specific species was less successful (e.g., the population of bison decreased because the human population increased) you will want to stress that this data doesn’t allow us to make causal claims but rather correlational claims (e.g., the bison population decrease was correlated with the human population increase).
 SHARE INITIAL IDEAS
PURPOSE | To share what we already know
Students reflect individually and create their initial models.
Have students take a minute and pause to think about the species stories activity and the similarities and differences in the trends happening across species and the connections to the headlines they read at the start of the lesson.
Display Slide I. Give students the opportunity to individually create an initial model to explain why so many species are declining now while a few seem to be expanding. Explain that you will be collecting the initial models. Student models should show different possible causes for why this might be occurring. To scaffold their thinking, have students consider the following questions as they are building their models:
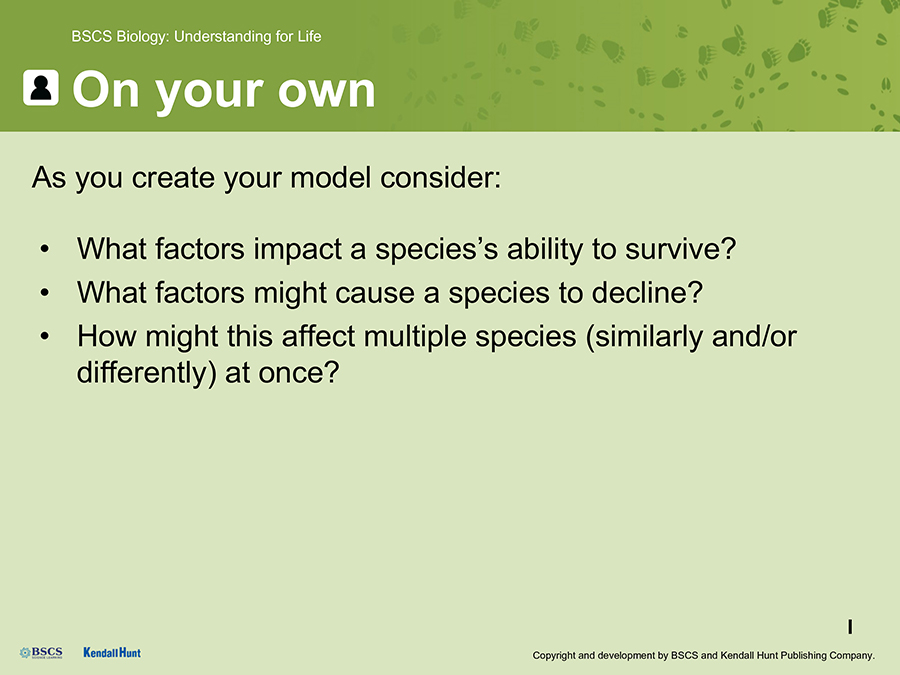
What factors impact a species’s ability to survive?
What factors might cause a species to decline?
How might this affect multiple species (similarly and/or differently) at once?
As students are sketching, you may choose to circulate to support students who may be struggling.
Some possible support prompts for students during this time might include:
For students struggling to start:
Remember that we have created these models in other units.
Remind them that they are just recording starting ideas to think about and build on.
Think about your Model Trackers you’ve been using all along; have you gotten more confident about conveying your ideas this year?
For students who feel hesitant to draw:
In our other models, the purpose of the sketch was just to show our thinking, not to make “beautiful” or fancy drawings.
Sometimes a simpler sketch is actually better at showing our ideas that we can build on later.
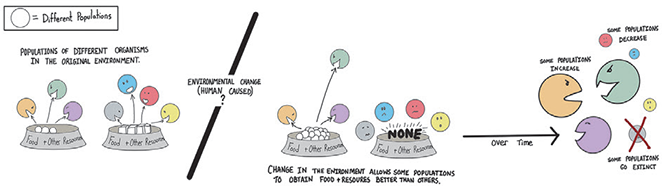
A sample of what a student initial model sketch could look like.
Attending to Student Ideas
Don’t worry if students’ models do not yet show much detail. Students will be revising their ideas across the unit. There is no need to belabor this activity, nor to push students to make “better” models.
Developing the Practices: Developing and Using Models
Students are developing a model in order to make sense of why so many species are declining now while a few seem to be expanding. From the species stories activity students may have noticed some similarities among the species that are declining or have gone extinct and the species that are expanding and may include those details in their models.
Formative Assessment Opportunity
Initial models are a great opportunity to get a sense of students’ understanding of the purpose and practice of sharing our ideas as models as well as what ideas they have from the then and now stories activity. Feedback should emphasize the value of getting all our ideas on paper, and at this time we should not expect completeness or accuracy.
Partners share and discuss initial models.
Display Slide J. Ask students to compare their model with their partner’s model. Students should use the prompts on Slide J to guide their discussion:
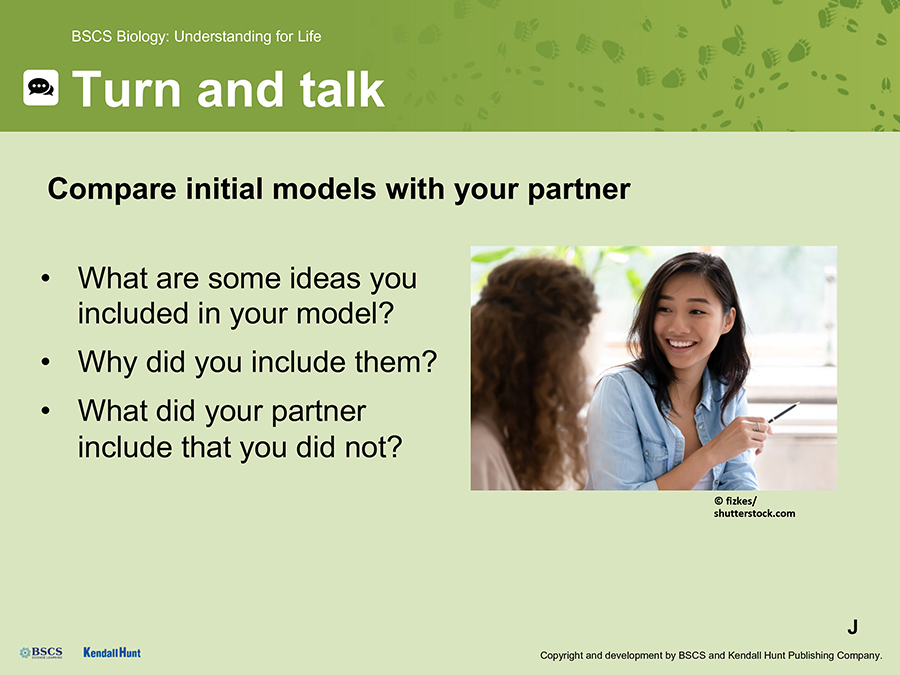
What are some ideas you included in your model?
Why did you include them?
What did your partner include that you did not?
Ask students to think about what questions they are still curious about and to record them in their science notebooks.
Remind students that as a class, we will build a consensus model to identify what we agree and disagree on regarding representation of our ideas. They still probably have some questions about what explains the changes in species populations and ranges over time. They should record those wonderings in their science notebooks. Collect the initial models while students record their questions.
SUGGESTED CLASS PERIOD BREAK
End of Day 2
SHARE INITIAL IDEAS
PURPOSE | To share what we already know
Develop an initial Class Consensus Model.
Display Slide K. Remind students that previously they worked with a partner to share their initial models about what happened to species populations and ranges over time. The purpose of this discussion is to identify ideas we agree or disagree about and areas we need to know more about. Share the Class Consensus Model chart. Have each pair share one thing they agreed on and one thing they disagreed on. Accept all ideas and be careful not to favor any idea over another. Record all ideas on the chart, leaving the center column blank.
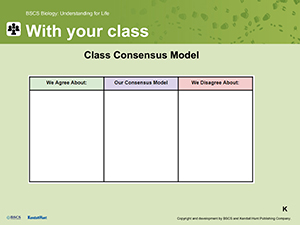

| We Agree About | Our Consensus Model | We Disgree About |
Construct our Class Consensus Model.
As a class, start to consider making a Class Consensus Model by looking for patterns in the ideas. Temporarily move those sticky notes that have ideas from both left and right columns of the chart to the middle column. Looking at all of the ideas moved to the center column, discuss how to use them to construct a Class Consensus Model. A sample of what the Class Consensus Model could look like is shown here:
 DEFINE GAPS
PURPOSE | To motivate further investigation
Identify gaps we still have about how populations, ranges, and the existence of species have changed over time.
Display Slide L. Partners review the Class Consensus Model and discuss additional questions or topics that need clarification. Invite the pairs to share their ideas related to what we need to know more about to promote a class discussion. While some changes to populations might garner attention from some students, the increase in the coyote population may go unnoticed. Consider pointing out the trends noted in the class chart.
| Suggested prompts | Listen for student responses such as |
|---|---|
| Are there trends in the changes we are still not sure about? |
|
| How might our own experiences with animals influence the questions we have or the data we choose to analyze? |
|
| Our questions and models are focused on the time between the end of the last ice age and now. How might this influence our understanding? |
|
 BROADEN
PURPOSE | To expand our thinking
Students observe other extinctions in history.
Display Slide M. Return students to the Species Then and Now chart and discuss that these extinct species are just a small segment that went extinct when the last ice age ended.

| Suggested prompts | Listen for student responses such as |
|---|---|
| What do you think about the percentage of species that went extinct at the end of the last ice age? |
|
| The headlines mentioned other mass extinctions. How might exploring those help us understand what is happening now? |
|
Students observe other extinctions in history.
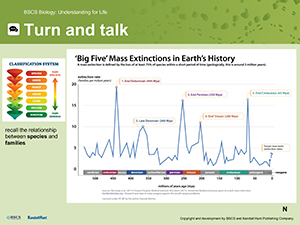
Display Slide N. Invite students to observe the graph and use an I2 strategy think-aloud to discuss what they see and what it means with their partners. Point out that the graph talks about number of families rather than species. Have students share prior knowledge and answer any questions to ensure all students understand the difference. Ask students to share out with the class.
| Suggested prompts | Listen for student responses such as |
|---|---|
| What components of the graph did you focus on and what did you think it meant? |
|
| What information is not shown by this graph? |
|
Literacy and Multilingual Learner Support
Spend a little time to help students interpret the y-axis of this graph. Students may think the peak on the line corresponds to the number of species that went extinct but it represents the rate of extinction. This rate is then used by scientists to calculate the percentage of species. The higher the rate, the higher the percentage of species that are lost is a relationship that can be inferred.
Partners investigate the causes and effects of mass extinctions.
Distribute Student Sheet 4.1.A: Mass Extinctions. Invite students to set a purpose for their reading that may be similar to: “What are the causes and results of mass extinctions?” and use other reading annotation stems to mark the text as they read.
| Suggested prompts | Listen for student responses such as |
|---|---|
| What was one thing you noticed about all of the mass extinctions? |
|
| What were some of the top effects or consequences of those causes? |
|
Add to the scaled timeline to accommodate a longer history.
Suggest that the mass extinction events might be important to note in terms of our timeline. We only went back to about 15,000 years. These events might help us understand changes in species extinctions over time. Return to the timeline students used to think about time from 15,000 years to present.
| Suggested prompts | Listen for student responses such as |
|---|---|
| What scale did we use for this timeline? | We used 1 mm to equal 50 years or 1 cm to equal 500 years. |
| Can we use the same scale to accommodate these additional periods in history? |
|
Post the piece of cash register tape, yarn, or masking tape you prepared to create a class timeline that can stay posted on the wall.
If you use 1 mm = 1 million years, then you can have a timeline that extends 4.6 meters.
For example, 1 mm = 1 million years, then 10 cm = 100 mm = 100 million years. Then, 100 cm = 1,000 mm = 1,000 million years (1 billion years), which can be represented by 1 meter. To accommodate Earth’s age of 4.6 billion years, you will need to create a model to 4.6 meters. Again, the calculations are not the focus here; rather, by scaling the amount of time to a distance within the classroom, students can see how much time has passed. They can connect when the spike in extinctions occurred on the timeline with information on the mass extinction student sheet and what forces seemed to change life on Earth drastically. Once the timeline is posted, add sticky notes or notecards to indicate the occurrence of the five different mass extinctions.
Students consider the amount of time that has passed and connect it to current changes in species declines and extinctions.
Display Slide O. Invite students to relate what they included in their then and now posters to other time periods in Earth’s history.

| Suggested prompts | Listen for student responses such as |
|---|---|
| How does a timeline or the graph of the mass extinctions help us understand our Species Then and Now stories? |
|
| How can seeing these mass extinctions and the smaller extinctions help us understand our Species Then and Now stories? |
|
 ASK AND ORGANIZE QUESTIONS
PURPOSE | To set the mission based on student questions
Develop and organize driving questions: reflect in groups and write down questions on sticky notes.
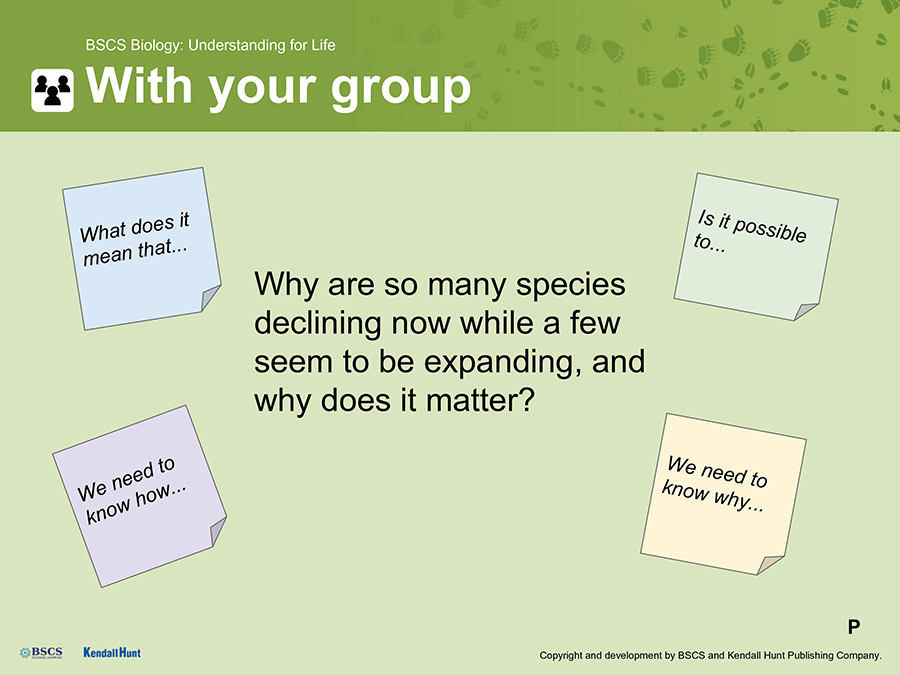
Display Slide P. Have the Class Consensus Model available to refer to. Note to students that we have generated a lot of questions individually and in groups about species and changes in their populations and existence over time. Refer to the Class Consensus Model and remind students that when we were making our models we were trying to figure out why some species are declining and others are increasing. Suggest that this would be a good time to capture some of our questions we have had all along the way in one place by creating a Driving Question Board (DQB).
This could be done either on a piece of chart paper or electronically using something like Jamboard. Whichever variation you choose, you will want to be able refer back to the DQB throughout the unit.
Write the following Driving Question on the DQB: Why are so many species declining now while a few seem to be expanding, and why does it matter?
At the same time, have students add this question to the title page for Lesson 1 in their science notebooks (where they wrote the date and “Lesson 1”).
Allow students to work in groups, to start writing individual questions in complete sentences on sticky notes, creating a pile of sticky notes for the DQB. Students should start by referring back in their science notebooks for questions that they had that relate to the unit Driving Question. Then students should work on creating additional questions by referring to the models we made earlier and any other notes on charts they created during the lesson. Have students write each question on their own sticky note that relates to the unit Driving Question. Lastly students should write any other questions relating to the unit Driving Question that have not been captured at this point. When each group has finished, have them divide all the sticky notes up so that every group member has roughly an equal number of questions to share.
Organize students into a Scientists Circle.
Have students get into a Scientists Circle, each person bringing some of the questions their group came up with. Remind students about the DQB process, going over the directions with them and reminding students the importance of hearing each other’s questions because we will have to figure out how we can investigate each other’s questions later.
Attending to Equity
Scientists Circle is a protocol for getting the whole class into a circle where they can see and hear everyone at once for certain key discussions. They have used this protocol in other units. Remind students that the purpose is to support students in expressing themselves and listening to peers during key discussions. Scientists Circles also provide opportunities to create a classroom culture centered around collaboration where students feel safe to share their ideas.
Students read their questions and organize their DQB.
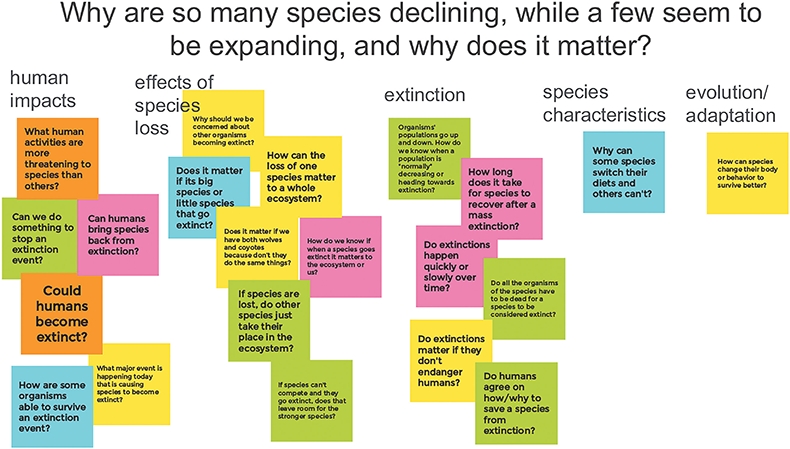
Ask students to take turns reading one of their questions aloud and then sticking it onto the chart. As each question is read aloud, invite students to place any similar or related questions around that sticky note in order to begin building categories of questions. You may invite students with fewer sticky notes to share first to ensure the greatest number of students have an opportunity to read a question aloud.
You might find it useful to tentatively name the general category you see a question relating to, and solicit students with similar questions to stick those to the chart.
For example, a suggested prompt might be:
“That sounds like a question related to . . . . .Who else has questions related to . . .?”
Group questions into general categories. Add a label for each category to the unit DQB. Let students know that we will have opportunities to reflect back on these questions to take stock of which we answer, as well as add new questions, as we figure things out through investigations.
| Sample categorie | Related questions |
|---|---|
| Species characteristics for success |
|
| Adaptation/Evolution |
|
| Human impacts |
|
| Effects of species declines/losses |
|
| Extinction |
|
Sample Driving Question Board
Students contemplate whether science has all the answers.
After you have grouped student questions, ask students to consider their list of questions. While still in their Scientists Circle, prompt them to think about the role of science in the answers to their questions and whether their perspective impacts the questions they are asking:
Which of these questions do you think we can answer with science?
Which do you think science can’t answer fully?
Do some questions also involve knowing more about history, society, opinions, ethics, or economics?
How might these questions differ if asked by people with different perspectives? What might a farmer/rancher ask? What about a conservation scientist working at a zoo to save a species? What about people making decisions about increasing the development of houses or industry?
Put a star next to any question students think might take more than scientific understanding to fully answer. We don’t need to know for sure—we’ll come back to this idea after we’ve figured out more about it.
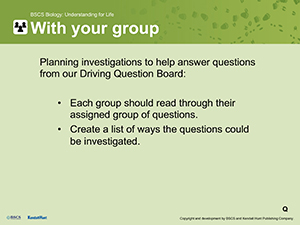
Students consider ways to investigate our questions from the DQB.
Display Slide Q. Have students return to their groups and assign each group an organized cluster of questions from the DQB. Have each group read the questions from their cluster and create a list of ways that they could investigate these questions to help us make progress on our Driving Question as well as the claims (on our chart paper) that could answer it.
Students may recall from their work in units 1 and 2 that investigating the data that others have collected or looking up what conclusions others have drawn from their data is valid and useful.
Groups share ideas for investigation with the class.
Have each group share their ideas for investigation and create a class list on a piece of chart paper of all the different ideas to investigate our questions. Write down all student ideas. Then, ask students to spot check the list to ensure that the ideas meet our standards for being ethical and possible to do.
| Suggested prompts | Listen for student responses such as |
|---|---|
| What kind of information or data could we investigate to start exploring some of these questions? What specific information could we look for or what investigations could we do? |
|
| What boundaries should we set for the kinds of investigations we do together? (Let students know that our investigations must be the kinds that are both possible and ethical.) | We should carefully consider any investigation that puts living things at risk. |
 NAVIGATE
PURPOSE | To maintain coherence and continuity
Motivate the next lesson.
Frame the discussion that, so far, we have thought a lot about how species populations and ranges have changed over time. We have generated and organized a lot of questions about how and why some species have declined and others have increased, how different factors can influence those population changes, and how some changes occur rapidly while other times, populations seem to be stable.
Invite students to look back at the Driving Question Board and notice patterns in some of the categories and questions:
| Suggested prompts | Listen for student responses such as |
|---|---|
| Look back at our Driving Question Board—what is the Driving Question we’re trying to answer in this unit? | Why are so many species declining now while a few seem to be expanding, and why does it matter? |
| Look back at the categories of questions we need to answer to get there—which of these would we need to answer first in order to understand most of the other categories? |
|
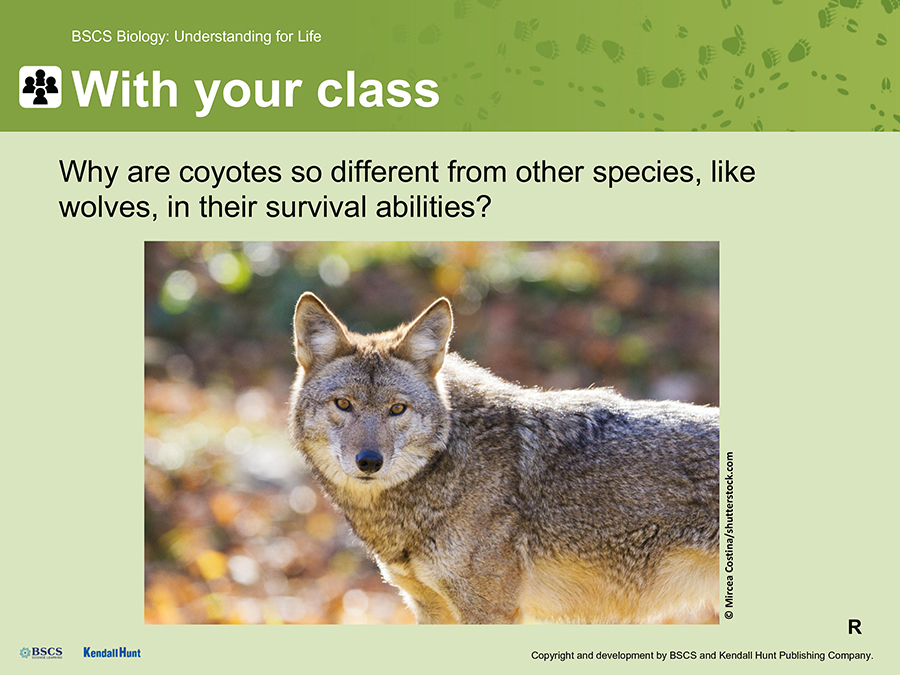
Display Slide R. Explain that in the next lesson, we should investigate why coyotes seem to be unique and why their outcome different from wolves in a changing environment.

SUGGESTED CLASS PERIOD BREAK
End of Day 3